
Figures & data
Figure 1. Cumulative and instantaneous efficacy curves per mortality setting.
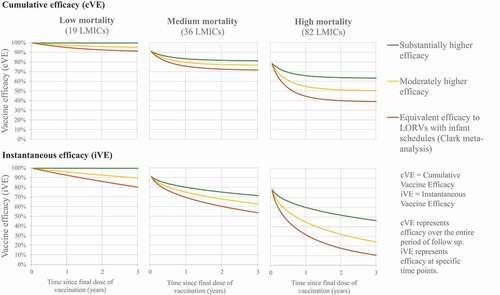
Table 1. Vaccination scenarios evaluated
Table 2. Vaccine characteristics, price per dose, and other inputs
Figure 2. Deterministic cost-effectiveness and probabilistic uncertainty analysis results for all LMICs over 10 years starting in 2025.
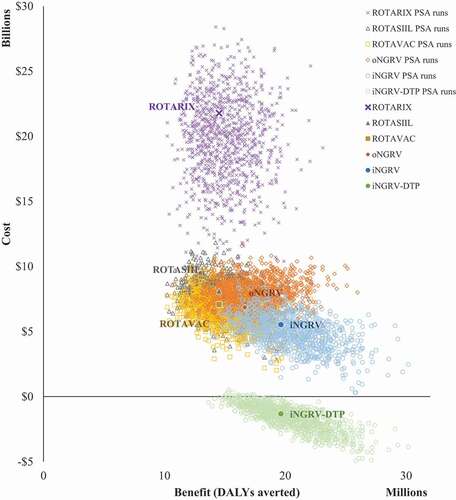
Table 3. Impact and cost-effectiveness results per vaccination scenario for all LMICs over 10 years starting in 2025
Table 4. Percentage of LMICs and Gavi countries with deterministic cost-effectiveness results below alternative national GDP per capita thresholds
Supplemental Material
Download MS Word (654.5 KB)Data availability statement
The authors confirm that the data supporting the findings of this study are available within the article and its supplementary materials. The model used is available online at https://www.paho.org/en/provac-toolkit