
Figures & data
Figure 1. Flow chart of subject disposition. n = number of subjects.
Table 1. Demographics and baseline characteristics-ITT population
Table 2. Summary of seroconversion (≥2 µg/ml) rates for Anti-Vi IgG antibody concentration by three age subsets and treatment groups-PP population
Table 3. Summary of geometric mean concentrations for three age subsets by treatment groups-PP population
Table 4. Fold increase of IgG antibody concentrations from baseline to Day 42 by vaccine group-PP population
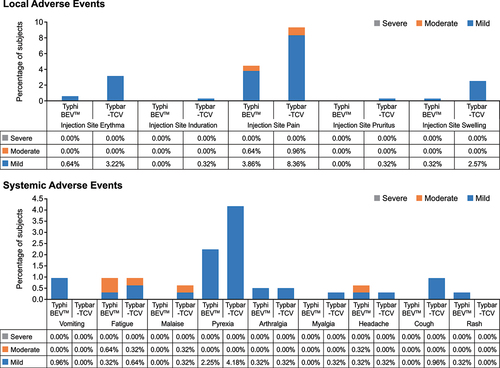
Figure 2. Local and systemic adverse events reported. TyphiBEVTM =Biological E’s Typhoid Vi-CRM197conjugate vaccine, Typbar-TCV=Bharat Biotech’s Typbar-Typhoid Vi-TTconjugate vaccine.
Supplemental material