
Figures & data
Figure 1. Cost-effectiveness model.
1Individuals susceptible to varicella may become infected with varicella. The probability of infection is age-specific. In vaccinated individuals, it is reduced by vaccination. The effectiveness of the vaccine may decline exponentially over time.
2Following a varicella infection, the individuals become permanently immune to varicella
3Unvaccinated susceptible individuals may receive a 1st dose of varicella vaccine. Susceptible individuals who previously received the 1st dose may then receive a 2nd dose of varicella vaccine (if a 2-dose schedule is considered). All-cause death is possible from any state. Varicella-related deaths are conservatively not considered.
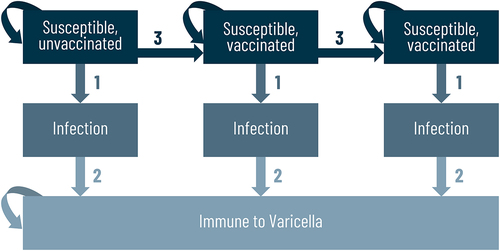
Table 1. Summary of base case inputs
Table 2. Cost-Effectiveness results*
Figure 2. Budget impact over a 10-year period (a) Strategy I – Varicella vaccine doses at 12 and 15 months (b) Strategy II – Varicella vaccine doses at 1 and 6 years compared to no vaccination.
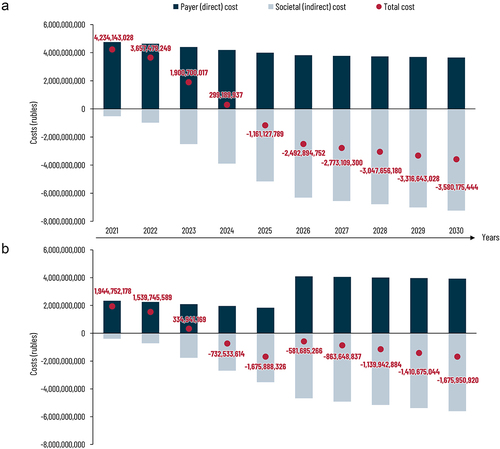
Figure 3. Deterministic sensitivity analysis (a) Strategy I – Varicella vaccine doses at 12 and 15 months (b) Strategy II – Varicella vaccine doses at 1 and 6 years compared to no vaccination.
GP: general practitioner; ICER: incremental cost-effectiveness ratio; Nb: number; QALY: quality-adjusted life year; TPP: third-party payer.
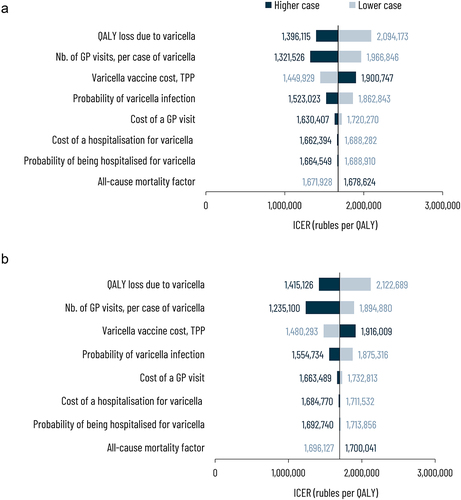
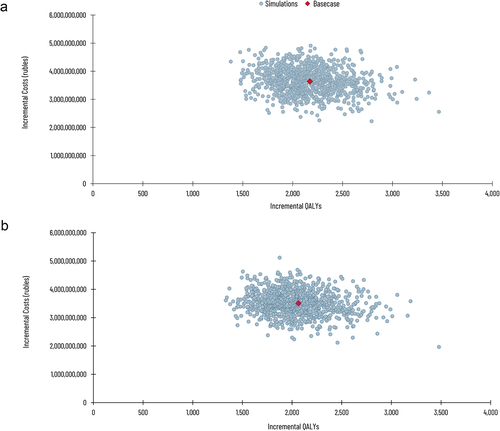
Figure 4. Probabilistic sensitivity analysis (a) Strategy I – Varicella vaccine doses at 12 and 15 months (b) Strategy II – Varicella vaccine doses at 1 and 6 years compared to no vaccination.
The red dot in the middle represents the base case among other 1000 other simulations in blue around that.
Supplemental material