Figures & data
Table 1. Human immune parameters of HIS-DRAGA mice.
Figure 1. Human ACE2 detection in the lungs of HIS-DRAGA mice.
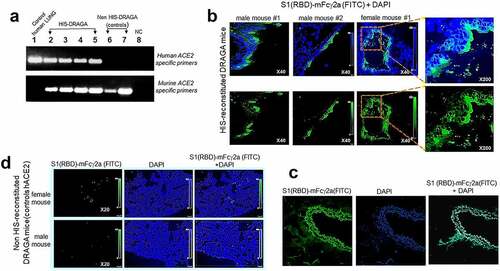
Figure 2. Quantification of hACE2 protein in HIS-DRAGA lungs.
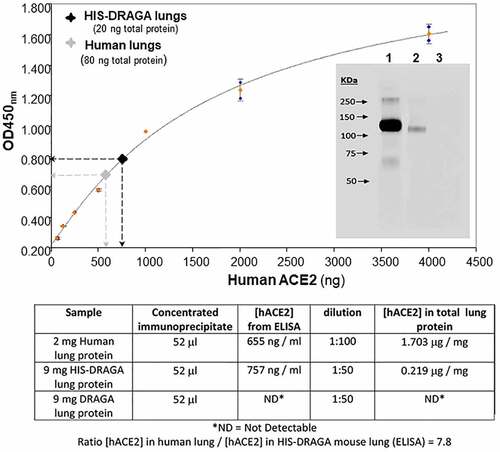
Figure 3. Co-Localization of hACE2 with hCD326 on alveolar human ECs in HIS-DRAGA lungs.
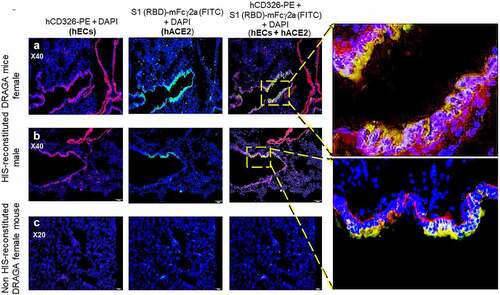
Figure 4. Dynamics of body weight changes following SARS-CoV-2 infection of HIS-DRAGA mice.
Figure 5. Lung pathology of SARS-CoV-2 infected HIS-DRAGA mice.
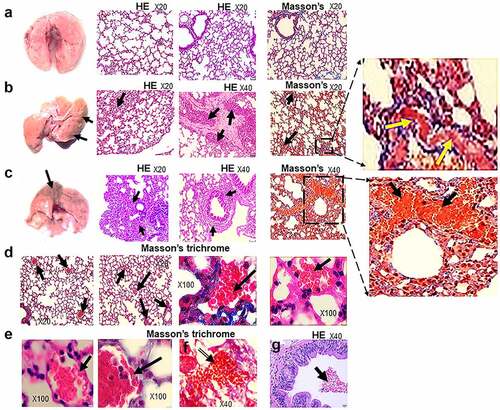
Figure 6. Intra-Alveolar microthrombi in SARS-CoV-2 infected DRAGA mice.
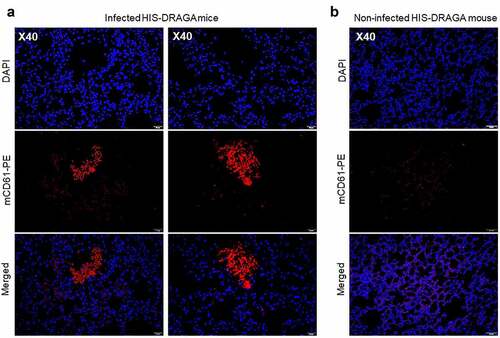
Figure 7. Pulmonary sequelae in SARS-Cov-2 infected HIS-DRAGA mice.
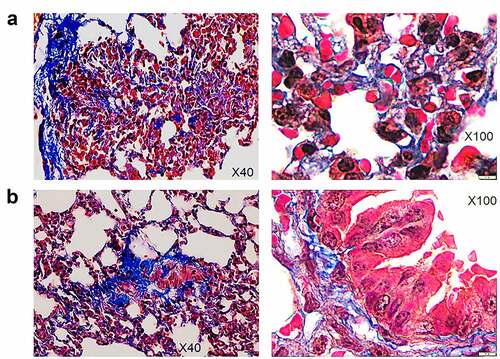
Figure 8. Infiltrating human lymphocytes in the lungs of SARS-CoV-2 infected HIS-DRAGA mice.
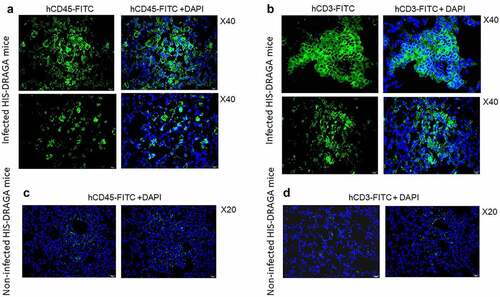
Figure 9. Human CD8+ T cell residency and cytotoxicity in the hCD326+ lung epithelial niches of a SARS-CoV-2-infected HIS-DRAGA mouse.
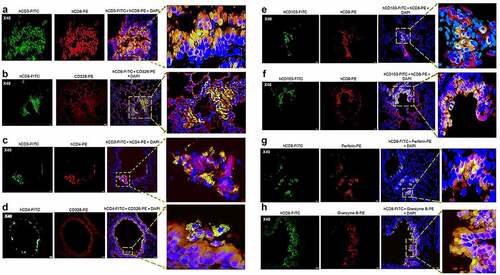
Figure 10. Human IgM and IgG serum titers to SARS-CoV-2 viral proteins in infected HIS-DRAGA mice.