
Figures & data
Table 1. Assignment of independent variables
Figure 1. Trends in the incidence rate and the number of severe cases of hand, foot, and mouth disease in Jiangsu Province from 2009 to 2020.
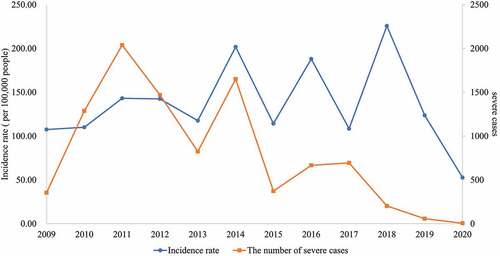
Figure 2. Distribution of pathogen types of severe hand, foot, and mouth disease in Jiangsu Province from 2009 to 2020.
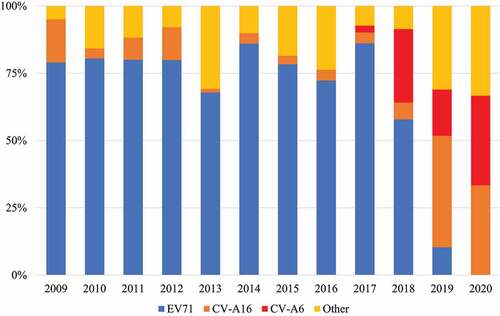
Figure 3. The composition of direct economic burden of patients with severe hand, foot, and mouth disease in Nanjing and Suzhou.
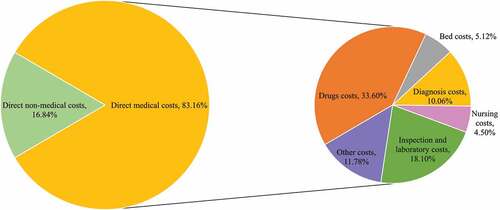
Table 2. The cost of patients with severe hand, foot, and mouth disease in Nanjing and Suzhou from January 2017 to May 2018 (RMB)
Table 3. Multi-Factor analysis of direct economic burden of patients with severe hand, foot, and mouth disease
Table 4. The TAPQOL scale score of patients with severe hand, foot, and mouth disease