
Figures & data
Figure 1. Yearly rubella cases and confirmation status and incidence rate, 2009–2020.
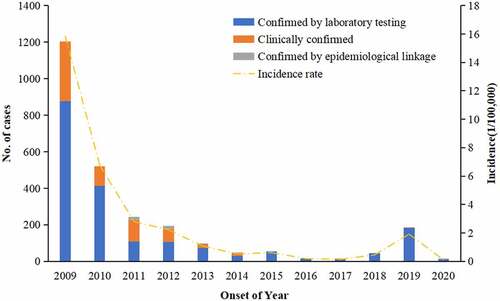
Figure 2. Reported rubella incidence by age group, 2009–2020.
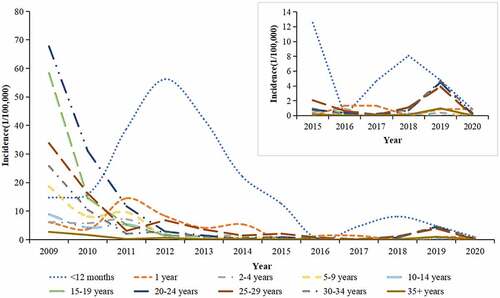
Figure 3. Reported rubella cases distribution by gender and age group.
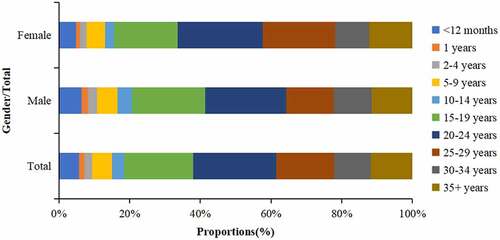
Table 1. Rubella vaccination status by age group, 2015–2020
Figure 4. Yearly positive rate for rubella IgG antibody, 2009–2020.
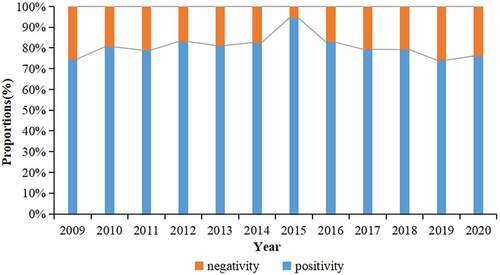
Figure 5. Seroepidemiology of rubella IgG in population by age groups.
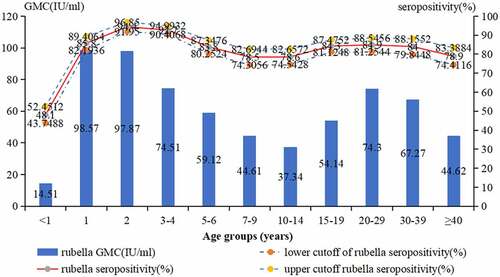
Table 2. Rubella IgG detection results in population among various groups, 2009–2020
Figure 6. Seroepidemiology of rubella IgG in population by year.
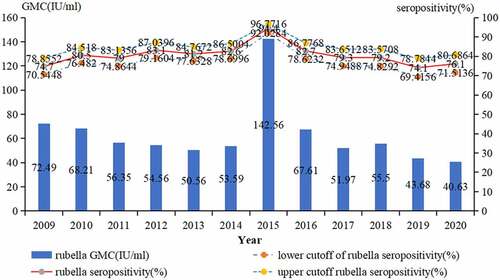
Table 3. Association of seroepidemiology of rubella IgG and related variables via multivariate analysis