
Figures & data
Table 1. The basic information of participants (n,%).
Table 2. Distribution of gender at five follow-up time points (n, %).
Table 3. Anti-Hbs levels during follow-up period.
Table 4. Mann-Kendall Test Results for anti-HBs levels at five time points.
Figure 1. Observed individual profiles (gray lines) and population-averaged estimation of Anti-HBs levels (blue and red line).
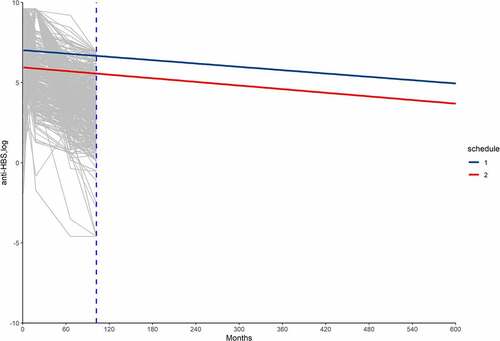
Table 5. Table parameter estimates and standard errors of the model.
Table 6. Predicted proportion of participants whose anti-HBs ≥10 mIu/ml.