Figures & data
Figure 1. Design and production of OMN008.
(a) Design of OMN008. The ectodomains of SinV E1 and E2 were cloned into the pOET1 bacculoviral transfer vector separated by a GS linker and directly downstream from a honeybee melittin (HBM) signal sequence. Subsequently, the SARS-CoV2 S protein RBD sequence was cloned downstream of SinV E1 separated by an additional GS linker and upstream of a tobacco etch virus (TEV) cleavage site and a 10x histidine tag. (b) The transfer vector was transfected into SF9 insect cells (Expression Systems LLC, 94-001F) to generate virus. The resultant cell supernatant containing recombinant baculovirus was twice further amplified at MOI 0.1 in SF9 cells to generate sufficient quantity of high titer virus. The resultant working stock of virus was then used to infect Tni cells (Expression Systems LLC, 94-002F) at MOI 10 for protein expression. 72 hours post infection the cell supernatant was harvested, centrifuged and filtered prior to chromatography. The filtered supernatant was adjusted to pH 8.0 and applied to DEAE ion exchange resin (Cytiva, 17070910) to remove media lipids and nucleic acid. Then the flowthrough from the ion exchange column was applied to a hydroxyapatite (HyAp) resin (Bio-Rad Laboratories, Inc. 1582000) to further remove media components and concentrate protein. HyAp elution was then applied to Ni2+ IMAC resin (Cytiva, 17531801) as a final purification step. The IMAC elution (c) was pooled, desalted (Cytiva, 17508701) buffer exchanged to final PBS formulation and concentrated by centrifugal ultrafiltration (Millipore Sigma, UFC903024). The final purified product was a single band at approximately 113kDa detected by immunoblot with an anti-his antibody (Biolegend, Inc., 362602). (d) OMN008 interaction with DC-SIGN was then confirmed by coprecipitation. Fc-DC-SIGN (Sino Biological Inc., 10200-H01H) was bound to OMN008 for 1 hour at 4°C and then to protein A beads (Thermo Fisher Scientific Inc., 15918014) for an additional hour. The resultant complex was run on SDS-PAGE and stained with SimplyBlue Safe Stain (Thermo Fisher Scientific Inc., LC6065). A strong band corresponding to OMN008 was precipitated with DC-SIGN. Images in A and B created with BioRender.com.
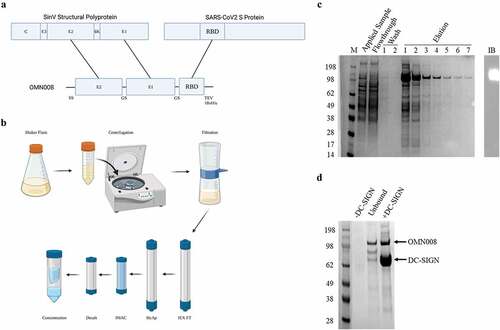
Figure 2. OMN008 induces a strong antibody response.
(a) Immunization regimen and groups. Eight-week-old C57BL/6 female mice (n=6) were randomized into five groups to be immunized with either SARS-CoV2 S RBD alone (Group 1) or OMN008 (Groups 2-5). Group 1 was immunized once on day 0 at 10 mg/kg. Groups 2–4 were immunized once at day 0 at 5, 10, and 25 mg/kg OMN008, respectively. Group 5 was immunized once at day zero and boosted at day 14 with 10mg/kg OMN008. Blood was drawn every 7 days during study. Collection for group 5 at day 14 was prior to dosing. Experiments here were performed by Explora Biolabs (San Diego, CA) in accordance with protocols approved by their Institutional Animal Care and Use Committee (IACUC). (b) Plasma collected at each time point was used in an indirect ELISA. SARS-CoV2 S RBD was coated onto high protein binding plates (Corning, 3590) prior to sample application. Bound plasma antibody was detected with anti-mouse HRP secondary (Jackson Immunoresearch, 115-035-003) and signal developed with TMB Substrate Kit (Thermo Fisher Scientific Inc., 34021). Each plasma sample was serially diluted threefold starting at 1:200. Data points were fit to a sigmoidal curve and endpoint titers were calculated with GraphPad Prism v9.2. Each ELISA plate included group 1 plasma at 1:200 dilution as a negative control and for baseline calculation which was 3 standard deviations above the average group 1 signal at 1:200 dilution. A mixed effects analysis was performed using GraphPad Prism v9.2 with Geisser-Greenhouse correction followed by Tukey’s multiple comparison test. *p=0.0129 (c) Neutralization titers were determined using a pseudotyped lentiviral microneutralization assay (Integral Molecular Inc., RVP-701L) Threefold serial dilutions of plasma starting at 1:30 were mixed with lentivirus at the recommended concentration and then hACE2 expressing cells (Integral Molecular Inc., C-HA-102) were added to allow infection to occur. After 72 hours cells were lysed with Renilla-Glo (Promega Corp. E2720) and luminescence was detected using a Spectramax M5 plate reader (Molecular devices LLC, San Jose, CA). Data points were plotted neutralization titers (ID50) were calculated similar to (B) using GraphPad Prism v9.2. Group 1 was set to 10 as signal reduction was nearly identical to infection in that absence of plasma. Image in A created with BioRender.com.
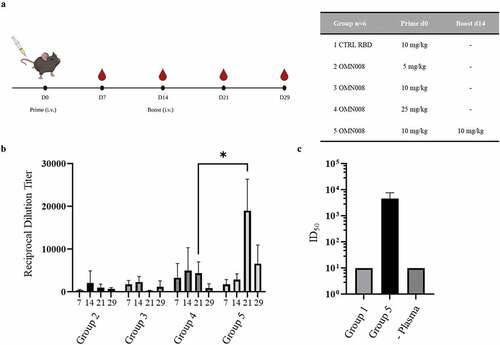
Figure 3. OMN008 vaccination induces functional CD8 T-cells.
Blood drawn at each time point was collected in K2-EDTA tubes and plasma was collected. The remaining cells were cryopreserved for transport from Explora Biolabs. Cells from group 1 and 5 d21 were thawed rapidly and PBMCs were purified using ficoll-paque (Cytiva, 17144002) then split into three sterile 12mm tubes. Two tubes were induced with a SARS-CoV2 S RBD peptide pool (JPT Peptide Technologies GmbH, PM-WCPV-S-RBD-1) for 24 hours. The other tube was rested overnight at 37°C and induced the following morning with Leukocyte Activation cocktail with GolgiPlug (Becton, Dickinson and Company, 550583) according to recommended protocol. Peptide stimulated cells were treated with GolgiPlug (Becton, Dickinson and Company, 555029) for 4 hours coinciding with the end of peptide stimulation. Cells were then spun and washed with PBS + 2% FBS (Atlas Biological, F-0500-A) treated with TruStain FcX (Biolegend, 101319) and stained for surface markers. Following surface stain cells were washed then fixed and permeabilized using Cyto-Fast Fix/Perm Buffer Set (Biolegend, 426803). Finally, the cells were stained for IFN-γ (Becton, Dickinson and Company, 554412) and analyzed on a FACSVerse flow cytometer (Becton Dickinson and Company, Franklin Lakes, NJ.). Panel used for surface staining is as follows CD3, CD4, CD8, CD44 and CD69 (Biolegend, 100327, 100412, 100722, 103022, 104507). Following gating on lymphocytes and single cells, a collection gate was set on CD3 positive cells and cells were subsequently gated for viability and CD4/CD8 before analyzing the percentage of cells positive for Interferon gamma and CD69. Percentages were plotted using GraphPad Prism v9.2. T-test (left panel) and one-way ANOVA (right panel) were also performed using GraphPad Prism v9.2, while differences were not statistically significant, we believe they are suggestive of a trend.