
Figures & data
Figure 1. Flow chart of study participants and their follow-up schedule.
Table 1. Participants characteristics at baseline (n = 422).
Table 2. Percentage of group with seroconversiona at each of two timepoints.
Table 3. Percentage of group with seroprotectiona at each of three timepoints.
Figure 2. Time course of HI antibody GMTs in vaccinated and unvaccinated participants. Influenza hemagglutination inhibiting (HI) antibody geometric mean titers (GMTs) between the vaccinated and unvaccinated groups by strain at day 0, day 30, and day 180 post-vaccination. AH1N1 vac: GMT of HI antibody to AH1N1 in the vaccinated group; AH1N1 unvac: GMT of HI antibody to AH1N1 in the unvaccinated group; AH3N2 vac: GMT of HI antibody to AH3N2 in the vaccinated group; AH3N2 unvac: GMT of HI antibody to AH3N2 in the unvaccinated group; BV vac: GMT of HI antibody to B/Victoria in the vaccinated group; BV unvac: GMT of HI antibody to B/Victoria in the unvaccinated group.
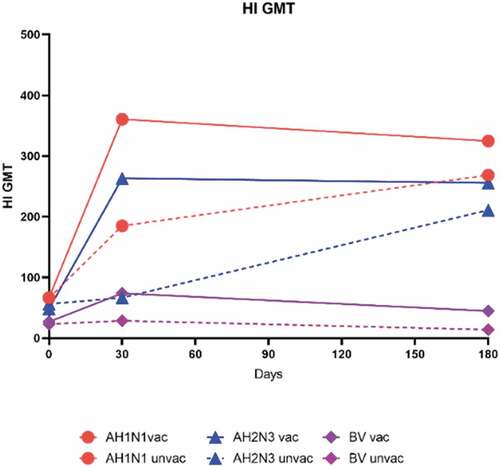
Figure 3. Influenza-Specific hemagglutination inhibiting antibody geometric mean titers (GMTs) between two vaccinated and unvaccinated groups by strain at day 0, day 30, and day 180 post-vaccination. GMT of HI antibody against AH1N1 (a), AH3N2 (b), or B/Victoria (BV) (c). GMT is shown above each bar. Error bars indicate 95% CIs. Unvaccinated participants did not receive the study vaccine (n = 138). Vaccinated participants received one dose of the study vaccine (n = 284). P-values result from a comparison between the two groups (vaccinated group versus unvaccinated group).
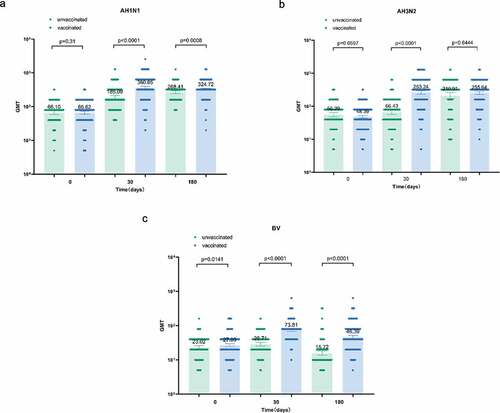
Table 4. Geometric mean titers (GMTs) of HI antibodies and geometric mean ratios among participants in the two groups by strain (N = 422).