
Figures & data
Figure 1. Plain language summary.
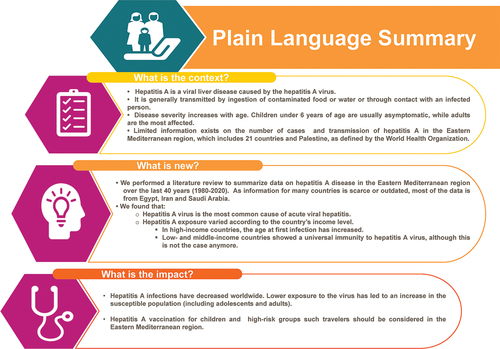
Table 1. Inclusion and exclusion criteria.
Figure 2. PRISMA flow diagram showing the study research and selection process.
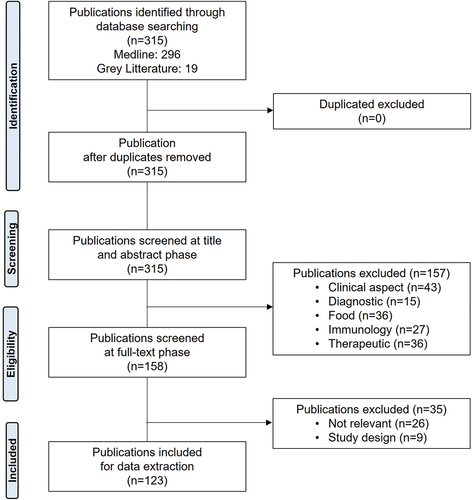
Figure 3. Classification of included countries by income level and hepatitis a vaccination status.
Notes: NIP, national immunization program; UAE: United Arab Emirates.
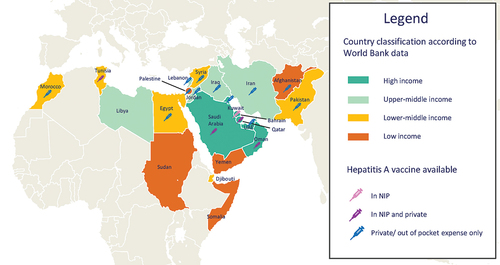
Table 2. Demographic characteristics and HAV vaccination status of the 22 EMR countries.
Table 3. Occurrence of HAV among acute viral hepatitis cases (41 studies).
Table 4. Seroprevalence of HAV (77 studies).