Figures & data
Figure 1. Study design. H3N2 pre-immune HLA-DR3 transgenic mice were used to evaluate the ability of the epitope enhancements to improve immunogenicity and protective efficacy against lethal challenge. Pre-immunity to H3N2 (1×10⁶ PFU, Hong Kong/2014) was established by a single intranasal exposure prior to vaccination. Mice (N = 18/group) were immunized by the intramuscular route with wild-type H7N9 VLPs (A/Anhui/1/2013) or VLPs carrying OPT1 engineered H7N9 HA without adjuvant eight weeks post-exposure and boosted four weeks later. A group of H3N2 pre-immune mice was not vaccinated (control). Mice were sacrificed one week (N = 4/group) or four weeks (N = 4/group) after the boosting (N = 10/group) for immunogenicity analysis or mice (N = 10/group) were challenged intranasally with H7N9 virus (1×10⁴ PFU, Anhui/2013) two weeks after boosting and monitored for weight loss and survival.
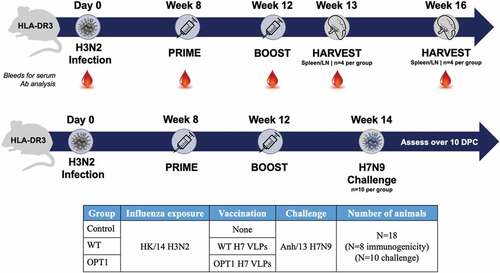
Figure 2. OPT1-VLP vaccination yields enhanced helper T cell responses over vaccination with WT-HA. (a) CD3+/CD4+ splenocytes within TSCM and TCM subpopulations display significantly elevated frequencies one week post-boost with OPT1-VLP, indicating enhanced antigen-driven proliferation in these compartments. Cells within the TEM subpopulation show no significant vaccine-induced expansion (data not shown). (b) However, OPT1-VLP vaccinees exhibit a higher frequency of antigen-experienced TEM cells than those with WT-VLP one week post-boost, while also exhibiting enhanced effector function (IFNγ production) at both one and four week post-boost timepoints (C). *=p < .05, **= p < .01, ***=p < .001.
Figure 3. OPT1-VLP vaccination yields sustained Tfh responses within splenic reservoirs. CD4+ T cells within TCM/TEM/TTE subpopulations from the lymph nodes (a) and spleen (b) were assessed ex vivo for CXCR5 expression. Splenic Tfh activation and function in OPT1-VLP vaccinated mice were measured by the upregulation of effector Tfh markers (c) and IL-21 production (D). *=p < .05, **= p < .01, ***=p < .001.
Figure 4. OPT1-VLP vaccination optimizes early Ab responses that correlate with spleen-derived Tfh. HAI titers were assessed in each animal enrolled in the study at four time points: pre-H3N2 exposure, pre-prime, pre-boost, and at termination (a). H7-specific HAI titers were measured starting at Wk12, four weeks post-prime. At both Wk12 and Wk13, OPT VLP vaccinated mice display significantly higher HAI than with WT-VLP. However, by wk16, HAI is comparable between the two groups. Furthermore, we find that HAI titer from terminal bleeds do not correlate with LN-derived Tfh at either timepoint (b). However, both total Tfh (c) and activated Tfh (d) frequencies in the spleen correlate with HAI titers at one-week post boost. *=p < .05, **= p < .01, ***=p < .001. Correlation determined by linear regression.
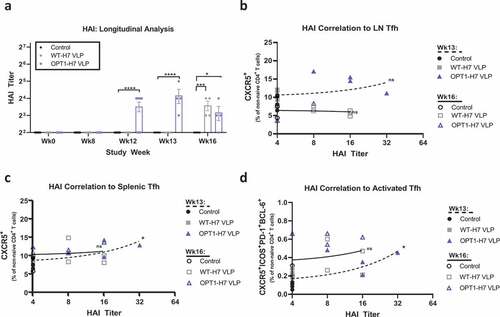
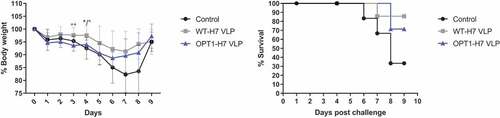
Figure 5. H7-VLP vaccines demonstrate similar efficacy against lethal challenge. (a) Mice challenged with H7N9 were monitored over a 9-day period post infection. We find a benefit in weight maintenance in animals vaccinated with WT-VLP over OPT1-VLP (blue) only at 3 days post-challenge, and over both H3N2 pre-immune, not immunized control (black) and OPT1 (blue) at 4 days post-challenge. However, during the more critical phase of illness, days 5–8, the two VLP vaccines were statistically similar. (b) Survival curves for both H7-VLP vaccines were also similar providing an additional 40–50% protection over that seen in pre-immune control animals. Body weight significance determined by ANOVA. Survival curves analyzed by log-rank test. *=p <.05, **=p <.01.