Figures & data
Figure 1. Participant flowchart.
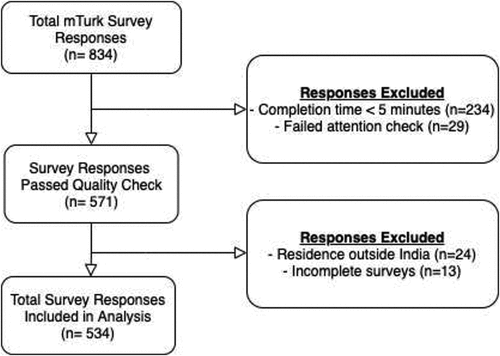
Table 1. Participant characteristics and prevalence of vaccine hesitancy (n = 534).
Table 2. Participant preferences for message aspects across six ads.
Figure 2. Participant ad preference overall and stratified by vaccine hesitancy status.
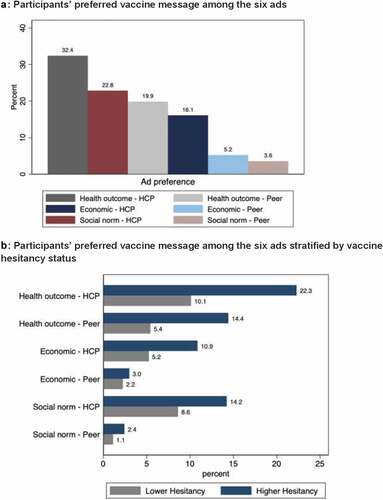
Table 3. Relative risk ratios of ad preference by vaccine hesitancy status and participant characteristics using multivariable multinomial logistic regression modeling.
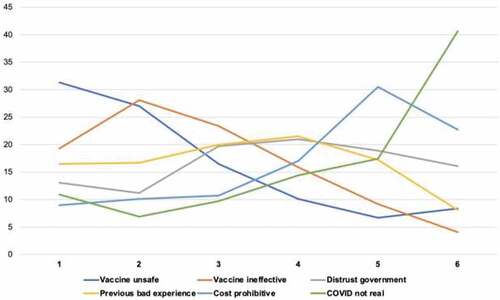
Figure 3. Participant ranking of COVID-19 vaccine concerns. Responses were 1, highest level of concern, to 6, lowest level of concern.