
Figures & data
Figure 1. Consort diagram of cancer cohort.
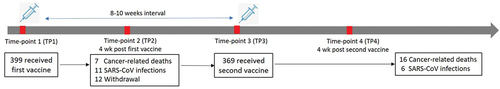
Table 1. Patient demographics and disease characteristics in cancer cohort.
Figure 2. (a) Incidence and severity of vaccine related adverse events following the first dose of ChAdOx1-nCoV-19 vaccine between cancer patients and healthy controls in all population. (b) Incidence and severity of vaccine related adverse events following the second dose of ChAdOx1-nCoV-19 vaccine between cancer patients and healthy controls in all population.
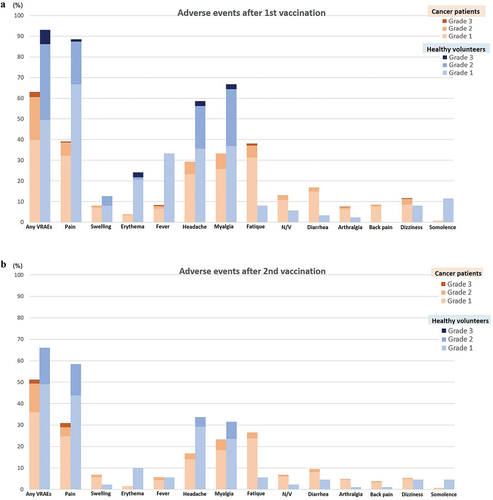
Figure 3. (a) Incidence of vaccine related adverse events on each day following the first vaccination in cancer cohort. (b) Incidence of vaccine related adverse events on each day following the second vaccination in cancer cohort.
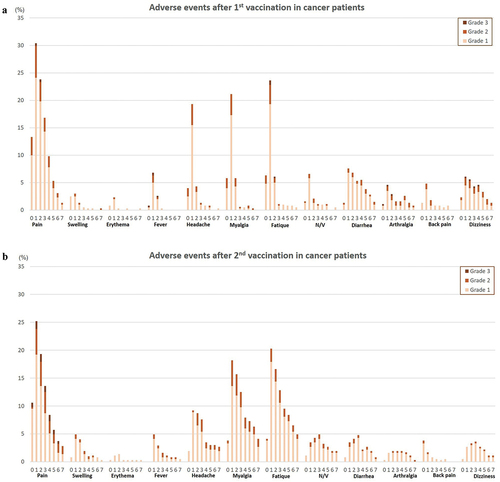
Table 2. Incidence of vaccine-related adverse events among cancer treatment types after first vaccination.
Table 3. Incidence of vaccine-related adverse events among cancer treatment types after second vaccination.
Table 4. Factors associated with any vaccine related adverse events after first vaccination.
Table 5. Factors associated with any vaccine related adverse events after second vaccination.
Figure 4. (a) Forest plot showing percentages of any grade vaccine related adverse events and risk differences following the first and second vaccination between cancer patients and healthy controls in all population. (b) Forest plot showing percentages of any grade vaccine related adverse events and risk differences following the first and second vaccination between cancer patients and healthy controls in age matched population.
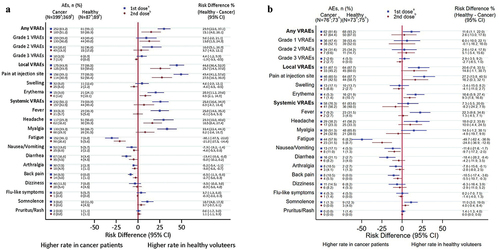
Table 6. Incidence of vaccine-related adverse events following the first and second vaccination between cancer patients and healthy controls in age-matched population.