
Figures & data
Figure 1. Varicella monthly incidence in Qingdao, China from 2007 to 2020. Solid line depicts smoothing spline in backward moving average with twelve periods in twice. Dashed line depicts the trend of incidence in Qingdao, China from 2007 to 2020. Int1: July 1st, 2013, the date of free one-dose VarV vaccination. Int2: July 1, 2016, the date of free two-dose VarV vaccination.
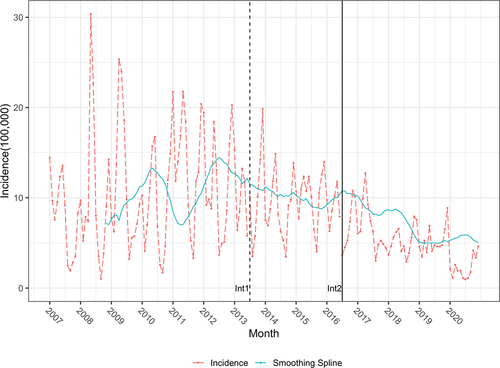
Table 1. The incidences and immunization strategies of varicella in Qingdao, China, 2007–2020.
Figure 2. ITS scatter plot of the monthly incidence rate of varicella after adjusted from 2007 to 2020 in Qingdao.Int1: July 1st, 2013, the date of free one-dose VarV vaccination. Int2: July 1st, 2016, the date of free two-dose VarV vaccination.
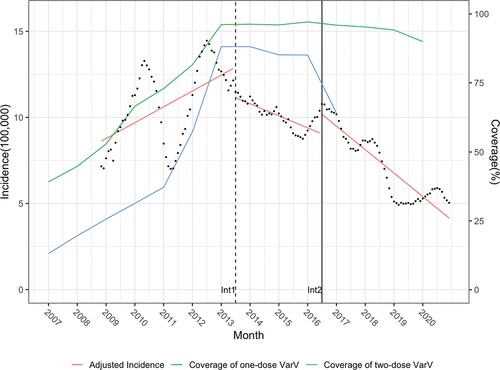
Table 2. Estimated level and trend changes of reported varicella incidence before and after VarV vaccination.