
Figures & data
Table 1. Quadrivalent (serogroups A, C, W, and Y) meningococcal vaccines currently licensed and available for use in the United States.
Table 2. Salient characteristics of the US-licensed MenACWY-TT conjugate vaccine.
Table 3. Summary of studies that supported the licensure of MenACWY-TT in the United States.
Figure 1. Immunogenicity findings of pivotal Phase II and Phase III studies of MenACWY-TT: Seroprotection rates based on post-vaccination Day 30 hSBA titers. The seroprotection rate was defined as the proportion of participants with post-vaccination hSBA titers ≥1:8. White bars depict data for MenACWY-TT and gray bars depict data for comparator vaccines.
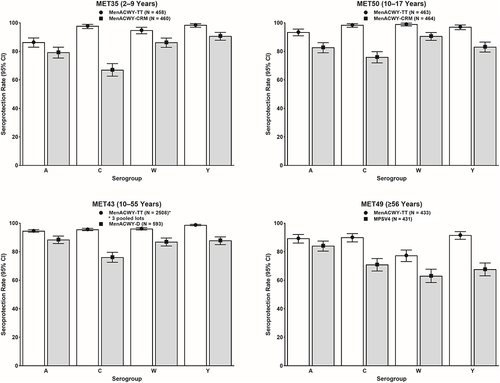
Figure 2. Immunogenicity findings of pivotal Phase II and Phase III studies of MenACWY-TT: Seroresponse rates based on post-vaccination Day 30 hSBA titers. The seroresponse rate was defined as the proportion of participants with post-vaccination hSBA titers ≥1:8 (for study MET50) and ≥1:16 (for all other studies) if pre-vaccination titers were <1:8 or with a ≥4-fold increase if pre-vaccination titers were ≥1:8. White bars depict data for MenACWY-TT and gray bars depict data for comparator vaccines.
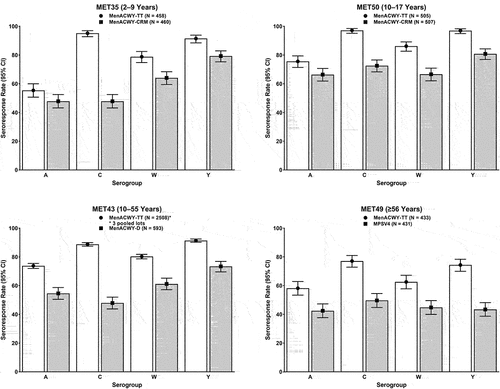
Figure 3. Immunogenicity findings of pivotal Phase II and Phase III studies of MenACWY-TT: Geometric means of hSBA titers on post-vaccination Day 30 in the per-protocol population. White bars depict data for MenACWY-TT and gray bars depict data for comparator vaccines.
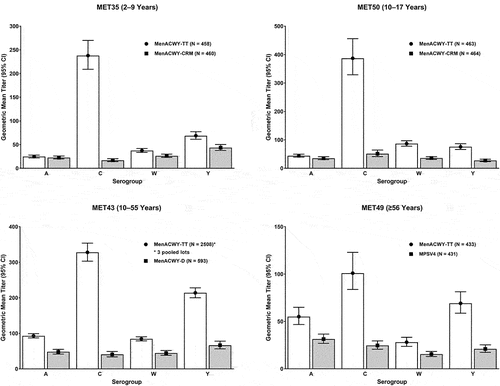
Figure 4. Immunogenicity of booster doses of MenACWY-TT among participants ≥15 years of age in Study MET56: seroprotection rates (top), seroresponse rates (middle), and GMTs (bottom) based on hSBA titers on post-vaccination Days 6 (left) and 30 (right) in the per-protocol population. White bars depict data for MenACWY-TT and gray bars depict data for MenACWY-D.
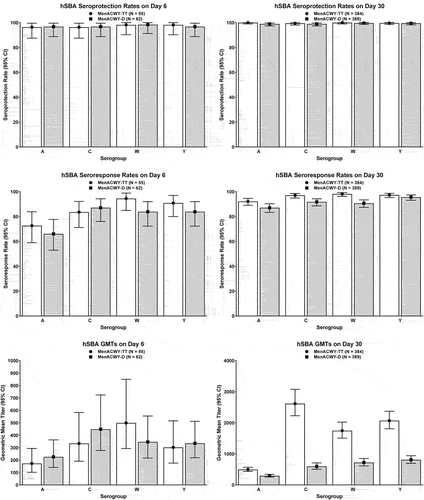
Figure 5. Immunogenicity of MenACWY-TT across age groups among adults ≥56 years of age in Study MET49: hSBA seroresponse rates on post-vaccination Day 30 in the per-protocol population. White bars depict data for MenACWY-TT and gray bars depict data for MPSV4.
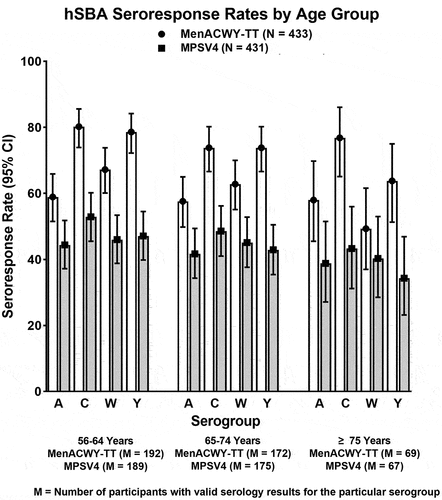
Table 4. Summary of safety findings of phase II and phase III studies of MenACWY-TT, safety analysis population.