
Figures & data
Figure 1. A hypothesized schematic image of the data and analysis and measurement of waning rate of immunity and duration of protective immunity.
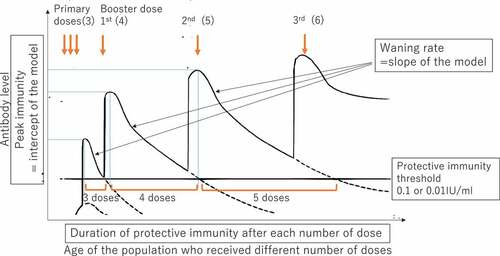
Figure 2. Results of literature search and flow diagram.
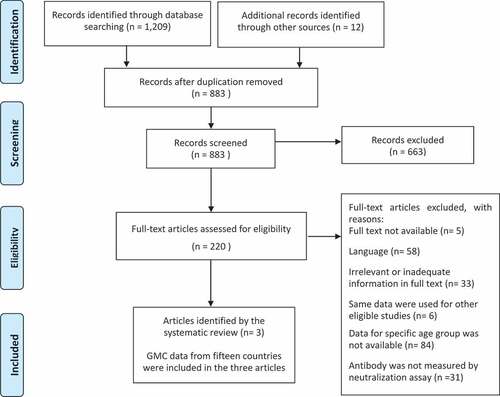
Table 1. Summary table of 15 countries included in the quantitative analysis.
Table 2. Age ranges and original sample sizes for the 15 countries population included in the quantitative analysis for waning rate of immunity. Citation30–32
Figure 3. Seroprevalence and DTP3 coverage by age and year of birth in data included in the analyses.
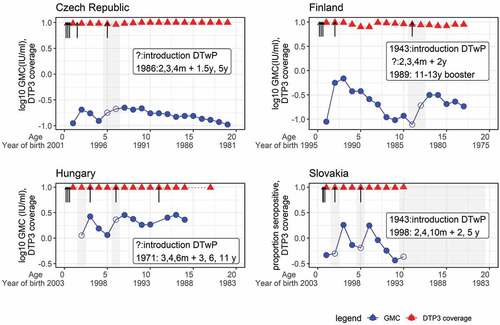
Figure 4. Declining trend of GMC over time after different numbers of DTP doses were given in 15 countries: Czech Republic, Denmark, Finland, France, Hungary, Ireland, Israel, Italy, Latvia, Luxembourg, Norway, Russia, Slovakia, Sweden, and the United Kingdom.
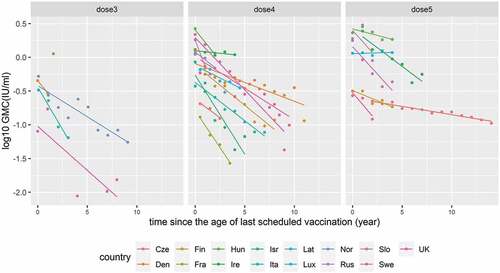
Table 3. The peak GMC level, annual percentage decrease of GMC level, and duration of protective immunity after three, four, and five doses: Duration of protective immunity was estimated as the time at which GMC declined to 0.1 IU/ml or 0.01 IU/ml.