
Figures & data
Figure 1. Selection criteria for screening of tweets.
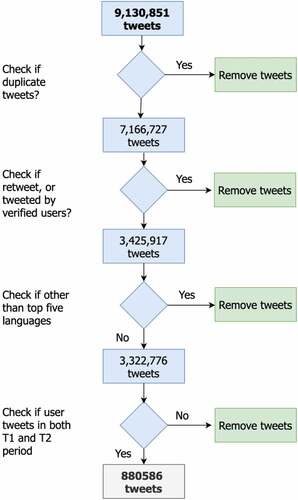
Figure 2. Definition of the shifts in sentiments. The shift is shown among the three states positive, negative, and neutral. N2P, U2P and N2U represent a positive shift in the sentiments. P2N, P2U and U2N represent a negative shift in the sentiments. U2U, N2N, and P2P represent a no shift scenario.
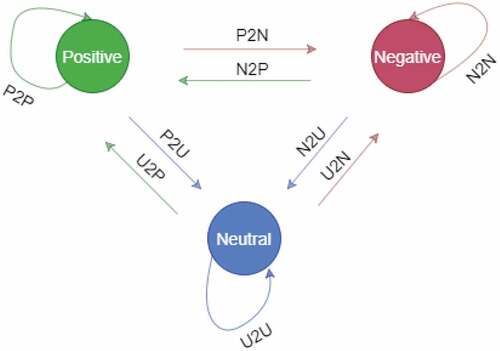
Table 1. Number of tweets and number of unique users of selected languages.
Figure 3. Change of Sentiment over time. (a) Before COVID-19 pandemic. (b) During COVID-19 pandemic.
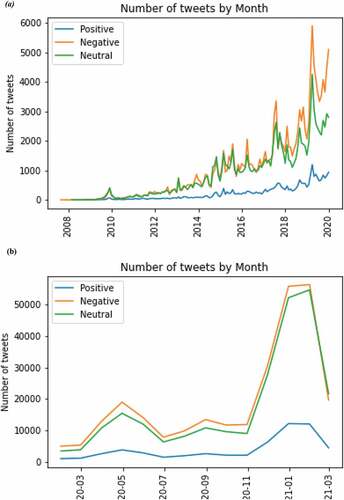
Table 2. The sentiments for the overall tweets and the shift in sentiments.
Figure 4. Percentage distribution of positive and negative tweets in T1 and period T2. A clear trend of rise in proportion of positive tweets and a decline in proportion of negative tweets can be seen while moving from period T1 to T2.
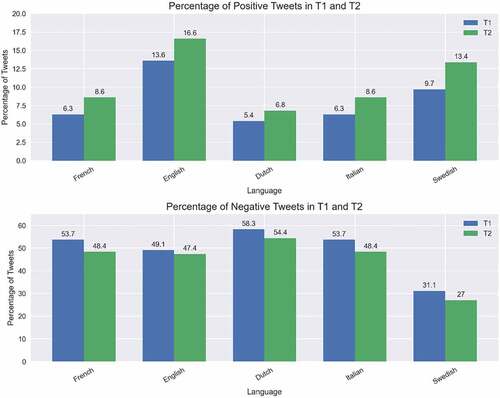
Figure 5. Number of users who demonstrated positive or negative in sentiments. Values are calculated in percentage. The length of the bar in each color corresponds to the percentage of users. For all the languages, the percentage of users showing positive shift exceeds the negative shift.
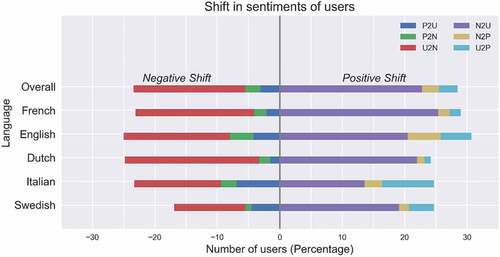
Table 3. Sentiment results for French tweets.
Table 4. Sentiment results for English tweets.
Table 5. Sentiment results for Dutch tweets.
Table 6. Sentiment results for Italian tweets.
Table 7. Sentiment results for Swedish tweets.