Figures & data
Figure 1. Isolation and activation of CD8+ T cells following vaccination with mD52. (a) mD52 vaccination schedule. Each individual animal was vaccinated i.m. With 50 micrograms of purified mD52 plasmid DNA in saline every 14–15 days for a total of 4 injections. (b) Schematic depicting in vitro CD8+ T activation. Pure CD8+ T cells were isolated from D52-vaccinated IL-10-deficient, IFN-γ-deficient, and wt mice and stimulated and expanded in vitro for RNA and protein isolation.
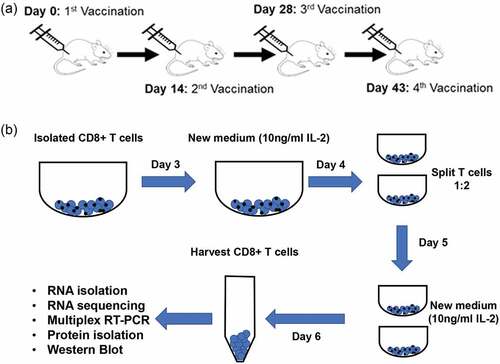
Figure 2. Library preparation and transcriptome sequencing of mRNA generated from total RNA isolated from CD8 T cells as described in . (a) Workflow schematic depicting mRNA library preparation and deep sequencing. (b) Schematic depicting the process used for mRNA library generation and transcriptome sequencing (courtesy of Novogene Corporation, Inc., with permission).
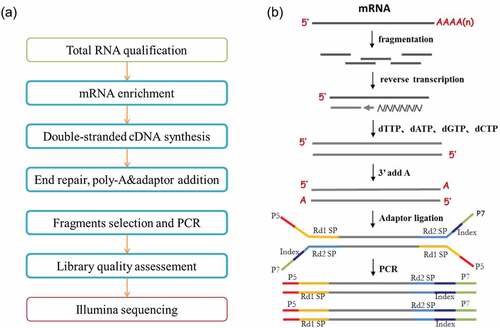
Table 1. Primer sequences used for reverse transcription-polymerase chain reaction.
Figure 3. Differential expression of genes in purified CD8+ T cells isolated from mD52-vaccinated mice deficient in IL-10 (IL10KO) or IFN-γ (IFN-γKO). Deep mRNA transcriptome sequencing and analysis was performed commercially by Novogene, Inc. (a) Venn diagram depicting total shared (10,593) and differentially expressed genes between CD8+ T cells from vaccinated mice deficient in IL-10 (326) or IFN-γ (337). (b) Hierarchical clustering heatmap of differentially expressed genes between CD8+ T cells from vaccinated mice deficient in IL-10 or IFN-γ. Red represents high expression genes and blue represents low expression genes. Color descending from red to blue, indicated log10 (FPKM +1) from high to low. Genes listed in colored boxes represent genes found in the region outlined in the respective color. (c) Differential expression of genes in CD8+ T cells from vaccinated IFN-γ-deficient mice against gene expression in CD8+ T cells from vaccinated IL-10-deficient mice. Increased expression of genes in IFN-γ-deficient (KO) CD8+ T cells (CD8+ IL-10+ T cells) compared to IL-10-deficient CD8+ T cells are depicted by a positive fold change. Decreased expression of a genes in IFN-γ-deficient (KO) CD8+ T cells (CD8+ IL-10+ T cells) compared to IL-10-deficient CD8+ T cells are depicted by a negative fold change.
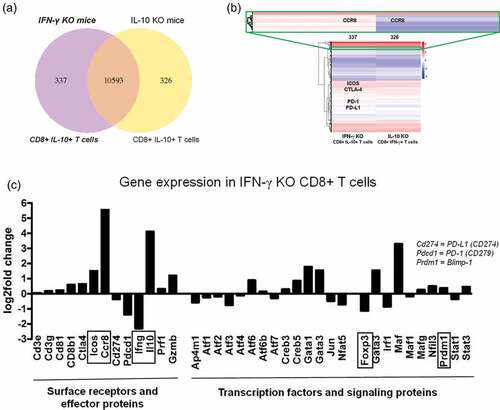
Figure 4. Multiplex RT-PCR confirmation of differentially expressed genes associated with CTLS in CD8+ T cells isolated from mD52-vaccinated IL-10-deficient (IL10KO), IFN-γ-deficient (IFN-γ KO), and wild-type (WT) mice. (a) Representative 30 cycle RT-PCR agarose gel showing expression of target genes expressed in CD8+ T cells from IL-10-deficient (IL10KO) and IFN-γ-deficient (IFNgKO) mice. From the left, the first two lanes are 1kb and 100 bp ladders, respectively. The H20 lane (far right of gel) represents no template controls. (b) Graphic representation of expression differences in target genes in CD8+ T cells from . (c) Representative 30 cycle RT-PCR agarose gel showing expression of target genes expressed in CD8+ T cells from wild-type (WT) mice. From the left, the first two lanes are 1kb and 100 bp ladders, respectively. The H20 lane (far right of gel) represents no template controls. d) Graphic representation of expression differences in target genes in CD8+ T cells from . Shown are target genes as a ratio of GAPDH expression (Primer/GAPDH). Individual values were calculated using intensity value ratio (IDV) of target gene to. The associated intensity ratio values shown in B and D are represented on the y-axis. Significance was determined using an unpaired t-test, p < .05.
Figure 5. Multiplex RT-PCR confirmation of differentially expressed genes associated Tregs in CD8+ T cells isolated from mD52-vaccinated IL-10-deficient (IL10KO), IFN-γ-deficient (IFN-γ KO), and wild-type (WT) mice. (a–c) are representative 30 cycle RT-PCR agarose gels showing expression of target genes expressed in CD8+ T cells from IL-10-deficient (IL10KO), IFN-γ-deficient (IFNgKO), and wild-type (WT) mice. From the left, the first lane is 1kb ladder. The H20 lane (far right of gel) represents no template controls. The genes of interest are indicated in white text within the gel image: (a) ICOS, PD-1, and PD-L1; (b) CCR8 and GAPDH; and (c) CTLA-4 and GAPDH (H20 control was negative, not shown). (d) Graphic representation of expression differences in target genes in CD8+ T cells from IL-10 KO mice and IFNg KO mice. (e) Graphic representation of expression differences in target genes in CD8+ T cells from wild-type (WT) mice. Shown are target genes as a ratio of GAPDH expression (Primer/GAPDH). Individual values were calculated using intensity value ratio (IDV) of target gene to. The associated intensity ratio values shown in d and e are represented on the y-axis. Significance was determined using an unpaired t-test, p < .05.
Figure 6. Real-Time RT-PCR confirmation of differentially expressed genes in CD8+ T cells isolated from mD52-vaccinated mice. Shown are graphic representations of expression differences in target genes in CD8+ T cells. (a–c) depict gene expression at 24 cycles of amplification, and (d–f) depict gene expression at 26 cycles of amplification. (a and d) compare expression of PD-1, PD-L1, and CTLA-4. (b and e) compare expression of Perforin 1 (Prf1) and Granzyme B (Gzmb) (c and f) compare expression of CCR8 and ICOS. Individual bars represent target genes (specific primers) as a ratio of GAPDH expression (Primer/GAPDH) from repeated experiments. Individual expression values were calculated using Delta Rn ratio of target gene to GAPDH. Significance was determined by unpaired t-test: *** p < .001, ** p < .01, and * p < .05.
Figure 7. CCR8 protein expression in CD8+ T cells isolated from mD52-vaccinated mice. (a) Western blot analysis demonstrating protein expression of CCR8 in CD8+ T cell whole protein lysates. GAPDH served as a control for protein loading. Molecular weight (mw) markers are shown on the far right. (b) Real-time RT-PCR confirmation of differential expression of CCR8 in CD8+ T cells isolated from mD52-vaccinated mice. Individual bars represent CCR8 expression differences, at 36 cycles of amplification, as a ratio of GAPDH expression (Primer/GAPDH). Significance was determined by unpaired t-test: *** p < .001.
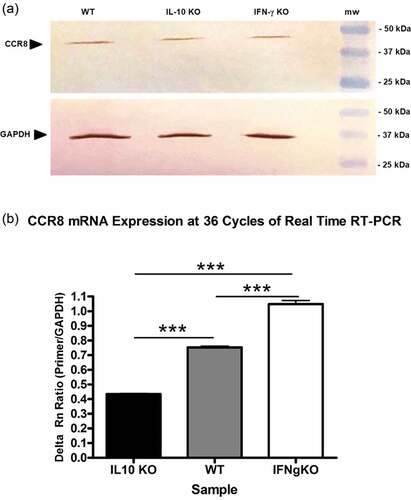
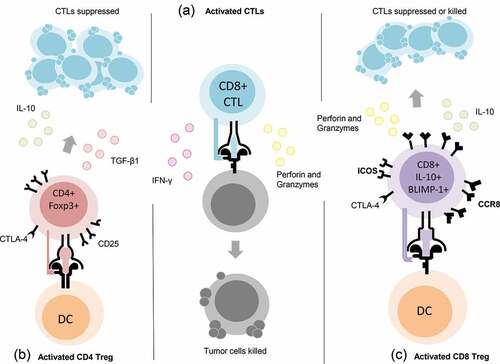
Figure 8. Proposed phenotype of a potentially unique population of CD8+ T regulatory (Treg) cells. Center column (a) depiction of CD8+ CTLs defined by secretion of IFN-γ, Perforin and Granzymes. Left column (b) depiction of CD4+ Treg cells defined by the expression of CD25, CTLA-4 and Foxp3 and the secretion of TGF-β1 or IL-10. Right column (c) depiction of CD8+ Treg cells elicited by vaccination with the oncogenic tumor-self protein D52 and defined by the expression of CTLA-4, ICOS, CCR8, and BLIMP-1, as well as secretion of IL-10, Perforin, and Granzymes (Grzb).