
Figures & data
Figure 1. The amount of articles related to mRNA vaccines published between 2010 and 2022.
Only research articles were included, while other publication types such as reviews, proceeding papers and meeting abstracts were excluded. Subject to the retrieval time (March 4, 2022), data for 2022 is incomplete.
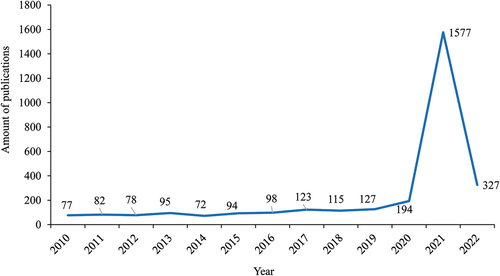
Figure 2. The network of Web of Science categories involved in articles related to mRNA vaccines published from 2010 to 2022.
The size of node indicates the amount of articles in each category, and categories with more than 130 articles were labeled. The thickness of the purple ring reflects the degree of betweenness centrality. Nodes in red indicate a sharp increase of citations detected.
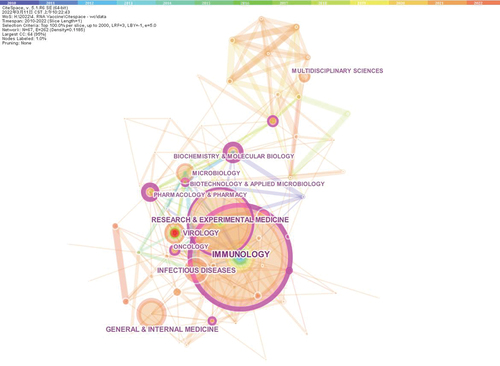
Figure 3. The co-citation network of references cited by articles related to mRNA vaccines published from 2010 to 2022.
Clusters are labeled in black text based on the top terms extracted by CiteSpace and based on in-depth reading of the main citing articles and cited references. Important references with the highest citations are labeled in purple text. The thickness of the purple ring reflects the degree of betweenness centrality.
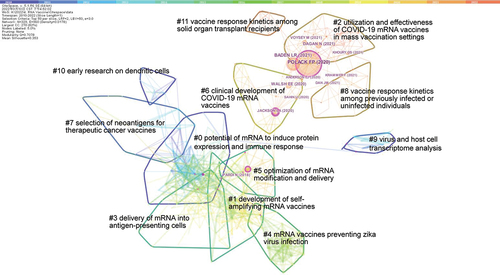
Figure 4. The timeline view of co-citation network.
Cited references with local cites above 20 were labeled on the figure. The thickness of the purple ring reflects the degree of betweenness centrality. Articles shown as red circles are those with rapid increase in citation counts, namely citation bursts.
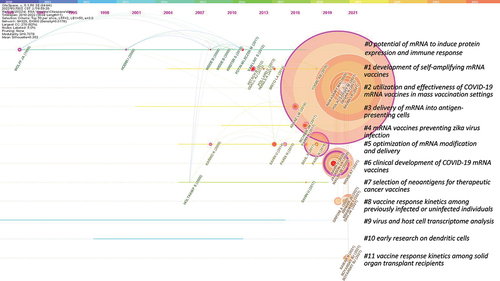
Table 1. Brief information of clusters in the co-citation network.
Table 2. Main citing articles and cited references in each cluster.
Table 3. Cited references with the highest citations, bursts, centrality.
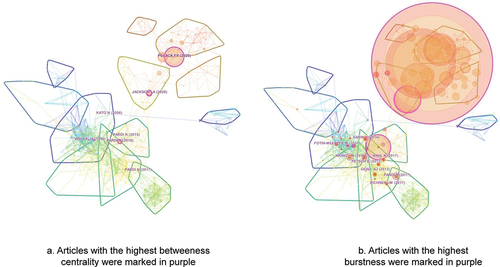
Figure 5. Nodes with the highest centrality and burstness in the co-citation network.
In order to show the articles with the highest burstness clearly, nodes in the right figure (b) were enlarged relatively to those in the left one (a).
Supplemental material