
Figures & data
Figure 1. (a) Markov cycle tree of Streptococcus pneumoniae. The structure of the “Program B” branch is the same as that of the “Program A” branch. SP: Streptococcus pneumoniae; OCAP: Outpatient pneumococcal pneumonia; ICAP: Inpatient pneumococcal pneumonia; AOM: Pneumococcal acute otitis media; OCAP_TD: Temporary disability after OCAP; ICAP_TD: Temporary disability after ICAP; MEN_TD: Temporary disability after meningitis; BACT_TD: Temporary disability after bacteremia; AOM_TD: Temporary disability after AOM; NDI: Neurodevelopmental impairment after meningitis. (b) Cycle tree for at least one major sequela from inpatient pneumonia. The structures of nodes C, D, E, and F in are the same as that of node B in . (c) Cycle tree for the multiple sequelae state.
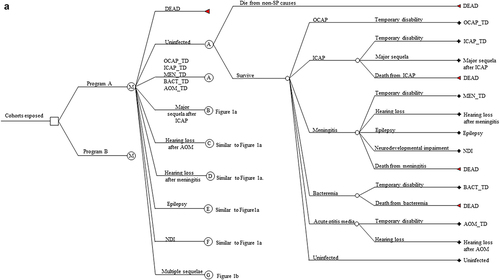
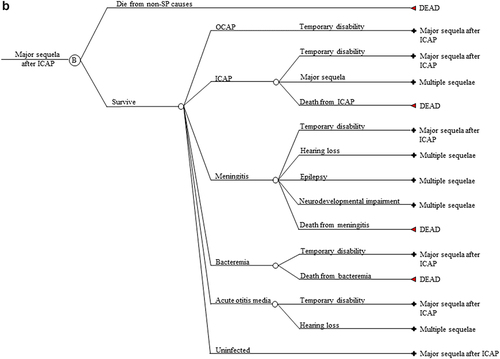
Figure 1. (Continued).
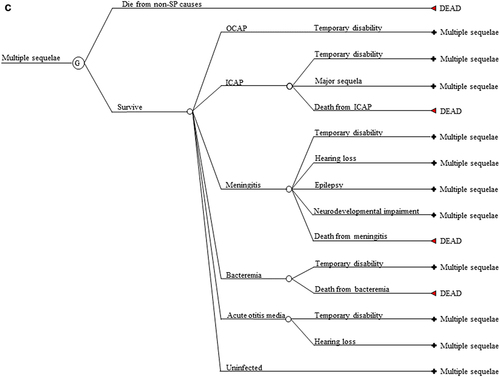
Table 1. Markov model input parameters.
Figure 2. Incidence rate projection model results. Overall invasive pneumococcal disease (IPD) incidence rate projections. Projections under a PCV10 program (red); Projections under a PCV13 program PCV13 (blue). Horizontal axis is time (in years) since the introduction of a universal pediatric PCV program.
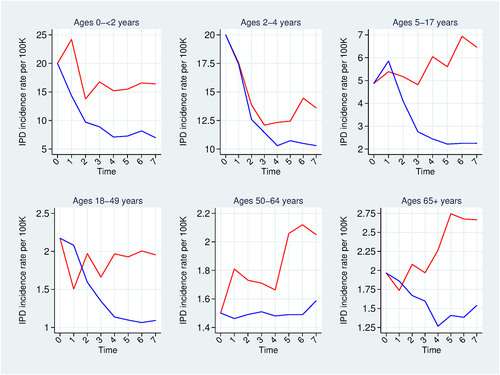
Figure 3. Incidence rate projection model results. Effect of pediatric PCVs against invasive pneumococcal disease. PCV effect = ((no program incidence – program incidence)/no program incidence)*100. PCV10 effects (red); PCV13 effects (blue). Population: 2016 and 2023 birth cohorts. Base-case analysis.
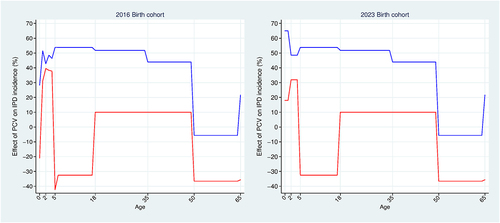
Table 2. Health-augmented lifecycle model input parameters.
Figure 4. Markov model results. Quality-adjusted life year gains for select birth cohorts. Base-case analysis.
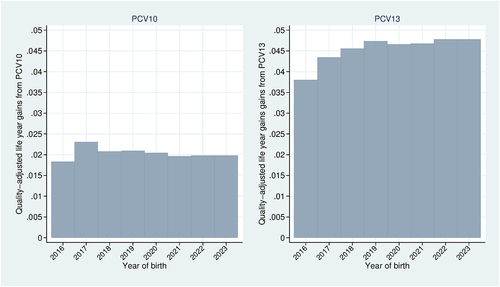
Figure 5. Health-Augmented lifecycle model results. Base-case analysis using the 2016 birth cohort. Value of a statistical disability year (black); Value of a statistical life year (dashed black); Full income (green); Full consumption (red); Annual earnings (blue).
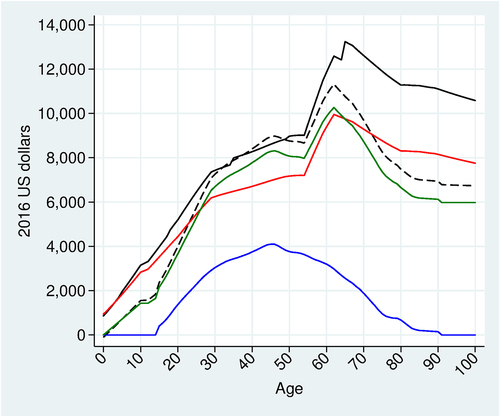
Figure 6. Markov model results. Vaccination effects on lifetime survival probability and lifetime health utility. Base-case analysis using the 2016 and 2023 birth cohorts. PCV10 effects (red); PCV13 effects (blue).
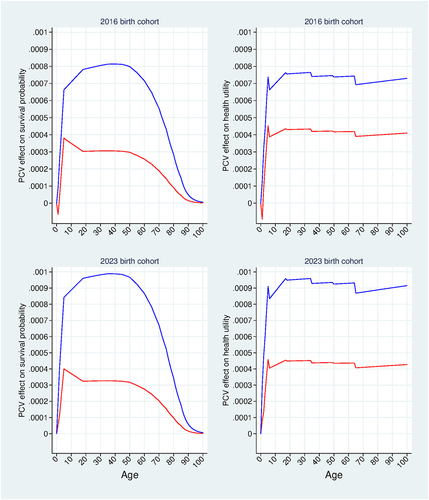
Figure 7. Willingness to pay (WTP) results. WTP for mortality risk reductions and morbidity risk reductions. Base-case analysis using the 2016 and 2023 birth cohorts. WTP for PCV10 (red); WTP for PCV13 (blue).
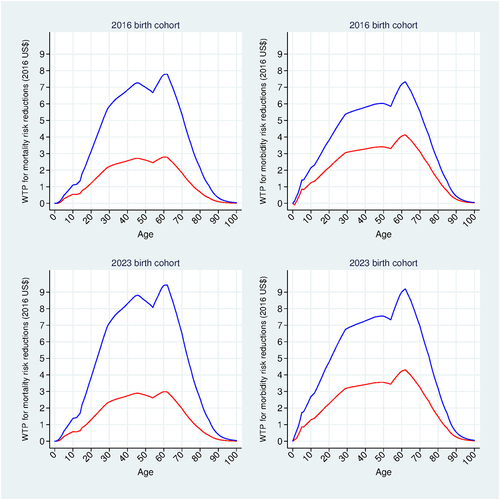
Table 3. Base-case incremental cases, hospital episodes, and mortality over a 100-year time horizon.
Table 4. Base-case results (95% confidence interval).
Table 5. One-way deterministic sensitivity analysis.
Table 6. Scenario analysis.