
Figures & data
Table 1. 5-option Likert scale used to evaluate agreement or disagreement for each specific item of the survey.
Table 2. Questions included in the statistical analysis as outcome variables.
Figure 1. Results of the multivariable logistic regression in form of forest plots of odds ratios with 99% confidence intervals.
* p < 0.01, ** p < 0.001
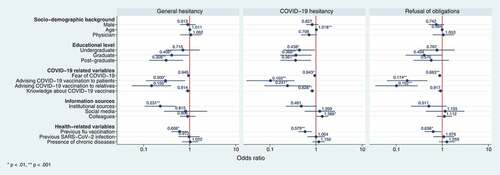
Table 3. Results of the multivariable logistic regression in form of odds ratio with 99% confidence intervals in brackets.
Table 4. Agreement or disagreement to single questions contributing to general scores.
Table 5. Descriptive analysis of the sample.