Figures & data
Figure 1. The study design, neutralizing antibody response and single B/T-cell sorting. All animal experiments were approved by the Institutional Animal Care and Use Committee (IACUC) of IMB, CAMS. Before starting the study, it was confirmed that the all monkeys did not carry anti-SARS-CoV-2 antibodies. Blood samples were collected from the animals at 14 days after the boost immunization and before the primary immunization. The serum and PBMCs isolated from the whole blood samples were stocked for the neutralizing antibody (NAb) titer, ELISpot assays and single T-cell and B-cell sorting experiments. (a) Scheme for immunization of rhesus macaques with two doses of inactivated vaccine or subunit vaccine. (b) the animal serum neutralizing titers were determined by standard microneutralization assays. The SARS-CoV-2 strain (SARS-CoV-2-KMS1/2020, GenBank No: MT226610.1) was used as the challenging virus of the standard microneutralization assays. Briefly, the heat-inactivated serum from macaques was serially diluted and incubated with SARS-CoV-2 live virus (100CCID50) for 2 hours at 37°C. Then, 100 μl of the Vero cell suspension (105 cells/ml) was added to the virus-serum mixture. The 96-well plates contained virus-serum mixture was then incubated at 37°C for 7 days. Neutralization Ab titers of every monkey from subunit vaccine group (n = 7) or inactivated vaccine group (n = 8) were detected after two doses of vaccine-inoculation. The values for the neutralizing antibodies are shown as GMT with 95%CI. The data came from three replicates experiments. (c) Comparison of average NAb titers to SARS-CoV-2 between the subunit vaccine (n = 7) and inactivated vaccine groups(n = 8). The values for the neutralizing antibodies are shown as GMTs with 95%CI. The t test was used for the neutralization titers assay. ****: p < .0001. (d) Antigen-specific IFN-γ response to SARS-CoV-2, as determined by ELISpot assay after two doses of vaccine-inoculation according to the manufactures’ protocols. The stimulated peptide mixtures used in the ELISpot assay covered the S1, S2 and N regions. The spot-forming cells (SFCs) per 10^6 PBMCs are counted by an ELISpot plate reader. The value of each column come from three monkeys with highest neutralizing antibody titers in each vaccine group. The Blank represents the PBMC isolated from these three monkeys before the primary immunization. The values are represented by mean±sd. The t test was used for the ELISpot assay. *:p < .05, **: p < .01,****: p < .0001. (e) for single cell-sorting, we labeled the SARS-CoV-2 S or N protein as SARS-CoV-2 S/N-PE antibody according to the PE Lightning-Link Conjugation Kit instructions. Then, PBMCs were stained with 100 μl of PBS containing a mixture of antibodies against anti-CD20-FITC, anti-CD27-APC, and SARS-CoV-2 N/S-PE for SARS-CoV-2-specific memory B cells sorting, or stained with a mixture of antibodies against anti-CD3-BV421 and SARS-CoV-2 N/S-PE for SARS-CoV-2-specific CD3+T cells sorting. After incubation for 30 minutes at room temperature in the dark. Finally, the SARS-CoV-2 memory B cells (CD20+CD27+ S/N protein+) (left panel)and SARS-CoV-2-specific CD3+ T cells (CD3+ S/N protein+)(right panel) were sorted as single cells by a BD FACSJazz cell sorter into 96-well plates containing 20 µl of cell lysis buffer. D0: The day before the primary immunization. D142st: 14 days after the boost immunization.
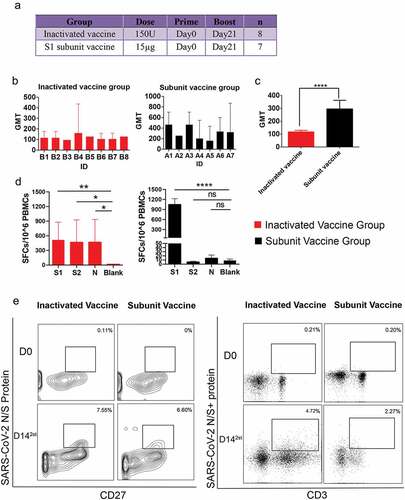
Figure 2. The gene characteristics of BCR IGH in the two vaccine groups. (a,b) IGH-V, IGH-D and IGH-J domain gene distributions for single SARS-CoV-2-specific memory B cells in the (a) inactivated vaccine group and (b) subunit vaccine group. (c) the usage frequencies of all IGH-V genes (y axis) and IGH-J genes (× axis) amplified from single viral antigen-specific memory B cells from the inactivated vaccine group (red dots) or subunit vaccine group (black dots). Point size shows the frequency (100%) of a V-J pairing. (d) The CDR3 AA length distribution of VH for the two vaccine groups.
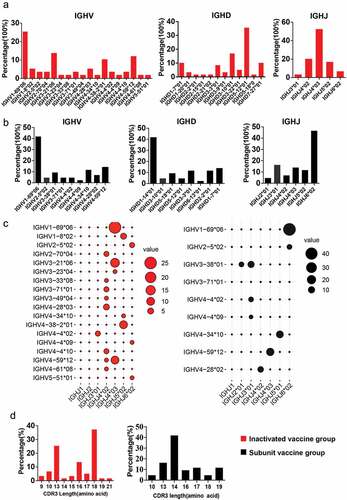
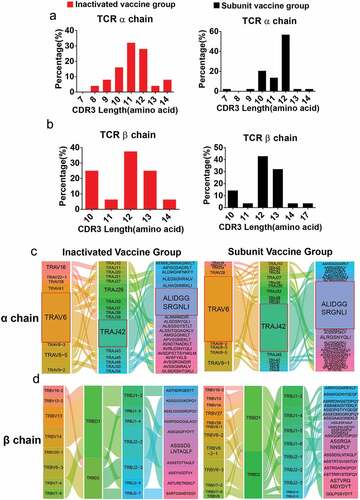
Figure 3. The gene characteristics of TCRαβ chains in the two vaccine groups. (a,b) the CDR3 AA length distribution of TCRαβ chains for the two vaccine groups. (c) The diagram shows COVID-19-specific TCRα chain V-J gene pairs in the two vaccine groups. The first, second and third columns represent TRAV, TRAJ, and CDR3, respectively. (d) The first to fourth columns represent the TRBV, TRBD, TRBJ, and CDR3, respectively. The area of the colors of each column (from left to right) was proportional to the frequency of the V, D, J or CDR3 gene sequence in all TCR clones from the two vaccine groups. The paired V-(D)-J with CDR3 genes are connected by smooth curves. The thickness of a line shows the frequency (100%) of a V-(D)-J-CDR3 pairing.