
Figures & data
Figure 1. The effect of COVID-19 vaccination on patients with historically diagnosed ITP. a: Analysis of the degree of platelet decline in ITP patients after vaccination, compared with the platelet base level before vaccination. b: Proportion of ITP patients with platelet deterioration after the first, second and third dose. c and d: Response to therapy in ITP patients with PC decline after vaccination.
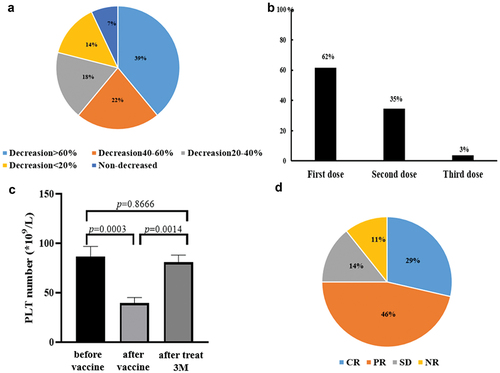
Table 1. The effect of COVID-19 vaccination on patients with historically diagnosed ITP.
Figure 2. The effect of COVID-19 vaccination on new diagnosed ITP patients claiming previous normal PC. a: After 3 months of treatment, the platelets of all patients recovered significantly to 139.4 × 10⁹/L. b: Response to therapy in ITP patients with PC decline after vaccination. ORR (CR+PR) is 100%. c: Proportion of ITP patients with platelet deterioration after the first, second and third dose.
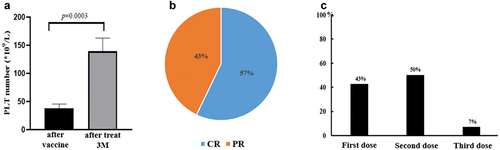
Table 2. The effect of COVID-19 vaccination on newly diagnosed ITP patients claiming previous normal platelet counts.