
Figures & data
Table 1. Characteristics of included studies.
Figure 1. Flowchart of study selection.
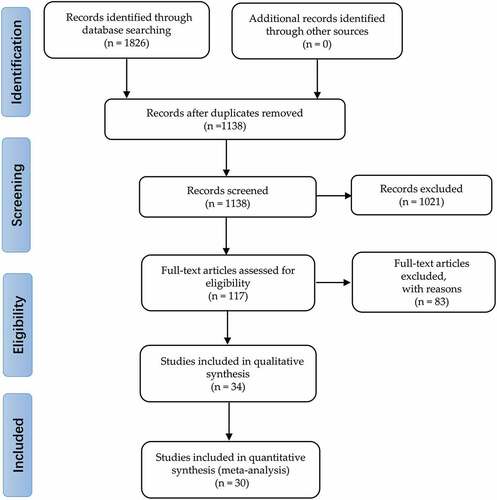
Figure 2. Pooled risk ratios for patients with solid cancer compared with healthy controls after a first dose of COVID-19.
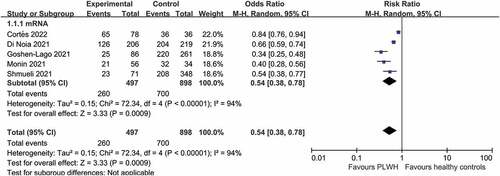
Figure 3. Pooled risk ratios for seroconversion among patients with solid cancer compared with healthy controls.
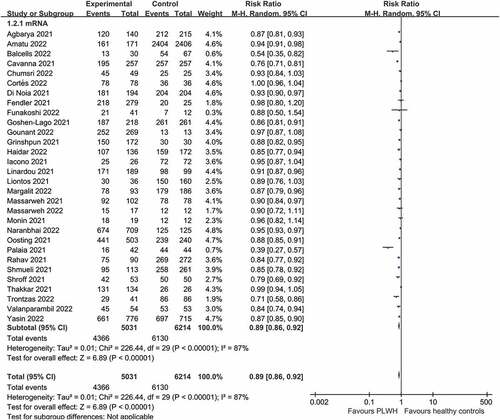
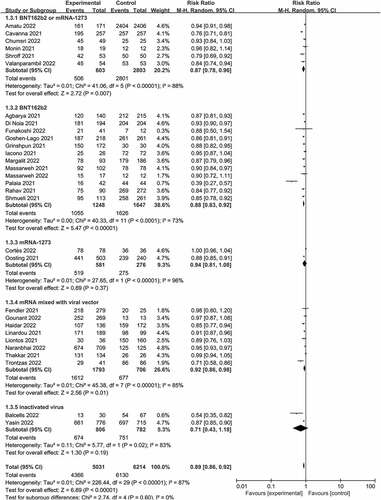
Figure 4. Subgroup analysis of vaccine type among patients with solid cancer patients after first dose.
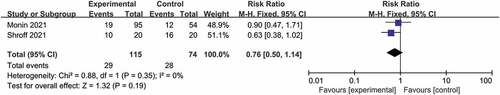
Figure 5. Subgroup analysis of vaccine type among patients with solid cancer patients after second dose.
Supplemental material