
Figures & data
Table 1. Demographic characteristics of the study participants.
Figure 1. Neighbor-joining phylogenetic trees for EV-A71 complete VP1 sequences (891 bp). The nucleotide substitution model used was the p-distance model. One thousand bootstrap replicates were used for construction of the phylogenetic trees; values >70% are shown. The scale bar represents a genetic distance of 0.02 nucleotide substitutions per site.The symbol “■” indicates 2008 clinical isolates; “●”indicates 2010, 2013, 2016 Chinese clinical isolates and BrCr-USA-1970 strain;“▲”indicates three strains of vaccine produced in China, the reference sequences are labeled with GenBank accession no./country/year.
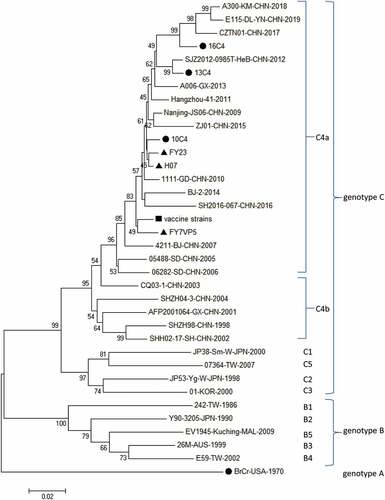
Figure 2. Variations were found in EV-A71 (VP1) of our study. ‘‘·’’ indicates matching to the FY23,FY7VP5,H07.
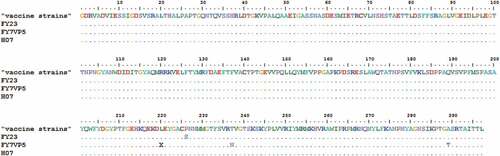
Figure 3. Variations were found in EV-A71 (VP1) of our study. ‘‘·’’ indicates matching to the BrCr-USA-1970.
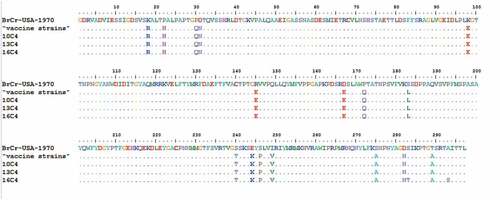
Figure 4. Variations were found in EV-A71 (VP1) of our study. ‘‘·’’ indicates matching to the “vaccin strains.” The ones marked with letters do not match.
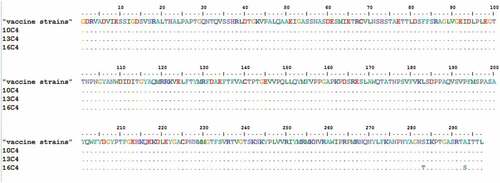
Figure 5. Age-Related GMT values of NtAb against five EV-A71 strains in different sexes in healthy individuals in Beijing, 2016. The y-axis represents the percentage of the NtAb GMT; the x-axis represents different ages. (a) vaccin, (b) BrCr, (c) 10 C4, (d) 13 C4 and (e)16 C4 among seropositive participants. Black, male; gray, female; NtAb, neutralizing antibody; GMT, geometric mean titers.
Table 2. Age-dependent seroprevalence and positive GMT values of five EV-A71 strains neutralizing antibodies in healthy individuals in Beijing, 2016.
Figure 6. Scatterplot representation of correlation between neutralizing antibody titers (NT50) against “vaccine strains” and four strains. (a) Scatterplot for samples seroneutralization-positive against both “vaccine strains” and BrCr strain. (b) Scatterplot for samples seroneutralization-positive against both “vaccine strains” and 10 C4 strain. (c) Scatterplot for samples seroneutralization-positive against both “vaccine strains” and 13 C4 strain. (d) Scatterplot for samples seroneutralization-positive against both “vaccine strains” and 16 C4 strain.
Figure 7. Age-stratified distribution of NtAb titers against. Antibody titers from 10-19-year, 20-29-year, 30-39-year, 40-49-year and 50-59-year of age are shown. The y-axis represents the percentage of the population with a given antibody concentration; the x-axis represents different ages. (a) vaccin, (b) BrCr, (c) 10 C4, (d) 13 C4 and (e)16 C4 among seropositive participants. NtAb, neutralizing antibody. GMT, geometric mean titers.
Data Availability statement
The data sets generated and/or analyzed during the current study are available from the corresponding author on reasonable request.