Figures & data
Figure 1. Experimental procedure. 3-month-old APP/PS1 mice were randomly divided into three pairs of mutually matched experimental and control groups. The experimental groups consisted of mice that were immunized with BCG once, twice, or three times and were named APP/PS1 + 1BCG, APP/PS1 + 2BCG, and APP/PS1 + 3BCG groups, respectively. The matched control groups were injected with PBS according to the same protocol as that for mice in the experimental groups. Mice in the APP/PS1 + 1BCG group were administered a single dose of the treatment at 18 weeks old. Those in the APP/PS1 + 2BCG group were administered a two-dose series of the treatment at 16 and 18 weeks, while those in the APP/PS1 + 3BCG group were administered a three-dose series at 14, 16, and 18 weeks. The control APP/PS1 mice were injected intradermally with 50 μL/mouse sterile PBS following the predetermined protocol. Two weeks after the last injection, the mice were anesthetized, and their tissue was harvested.
Figure 2. Regulatory effects of Bacillus Calmette – Guerin (BCG) treatment on dendritic morphology in the hippocampal CA1 area of APP/PS1 mice. (a) Representative image of a typical pyramidal cell used for analysis. The different compartments of the dendritic tree are indicated. (b) Histogram showing a comparison of the number of primary neurites in the hippocampal pyramidal cells, which increased following BCG treatment two and three times, relative to the number corresponding to the APP/PS1 mice; 1, 2, and 3 represents APP/PS1 mice injected with BCG once, twice, and three times, respectively. (c–e) APP/PS1 + 3BCG mice showing significant increases in total dendritic length, apical dendritic length, and average dendritic length, respectively, compared with APP/PS1 mice. APP/PS1 + 2BCG showed an increased apical dendritic length at two weeks following treatment. Data were analyzed by performing Student’s t-test, and the results obtained are presented as the mean ± SEM. n = 9 neurons (three neurons each from the three mice). *p <.05 and **p <.01 vs. vehicle control.
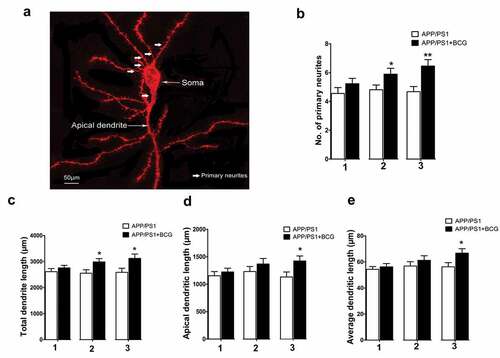
Figure 3. Regulatory effect of Bacillus Calmette – Guerin (BCG) treatment on dendritic complexity in the hippocampal CA1 area of the APP/PS1 mice. (a) Graph showing the variation of dendritic complexity as the function of the distance to the cell body of the hippocampal neurons in the CA1 area under control conditions or BCG vaccination. The dendritic complexity of the neurons expressing the indicated constructs was measured via the Sholl analysis. Intersections at various radial distances (10–200 mm) from the center of the cell soma were significantly improved following three-time BCG immunizations. (b) Fractal dimension (FD) of CA1 neurons in the different experimental groups. APP/PS1 + 3BCG mice showed a significant increase in FD. (c) APP +3BCG group showing a significant increase in the number of branch points. Data were analyzed by performing the Student’s t-test and the results obtained are presented as the mean ± SEM. n = 9 neurons (three neurons each from the three mice). *p <.05 and **p <.01 vs. vehicle control.
Figure 4. Regulatory effect of Bacillus Calmette – Guerin (BCG) treatment on spine morphology in the hippocampal CA1 area. (a) Use of DiOlistic assay to visualize dendritic spines. Individual hippocampal neurons corresponding to APP/PS1 and APP/PS1+BCG mice; representative sections of lateral dendrites from APP/PS1 and APP/PS1+BCG groups are also shown. Three-time immunization with BCG increased spine density (b), spine area (c), and spine head width (e) relative to APP/PS1 mice. Spine length in APP/PS1+BCG mice show no significant alterations relative to the control mice (d). Data were analyzed by performing Student’s t-test and the results obtained are presented as the mean ± SEM. n = 9 neurons (three dendritic segments per neuron, and three neurons each from the three mice). *p <.05 and **p <.01 vs. vehicle control.
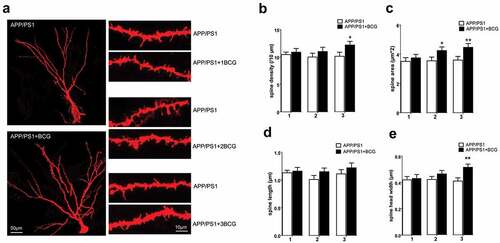
Figure 5. Alteration of the cytokines levels in the hippocampus and serum following Bacillus Calmette – Guerin (BCG) treatment. The normalized and analyzed levels of TNF-α, IL-4, and IFN-γ in serum (a) and hippocampus (b); 1, 2, and 3 represents APP/PS1 mice injected with BCG once, twice, and three times, respectively. In serum, BCG vaccination up-regulated IL-4 and IFN-γ expression, and down-regulated TNF-α expression, and changes in the levels of these cytokines in the hippocampus were almost consistent with those in serum. Data were analyzed by performing Student’s t-test and the results obtained are presented as the mean ± SEM normalized to the controls. n = 6 for each group. *p <.05, **p <.01 and #p <.001 vs. vehicle control.
Figure 6. Regulatory effect of the Bacillus Calmette – Guerin (BCG) treatment on the expression of JAK2/STAT3 and synaptic proteins in the hippocampus. APP/PS1 + 2BCG and APP/PS1 + 3BCG groups showed significant increases in the expression levels of p-JAK2 (c) and p-STAT3 (e) compared with their matched controls. The APP/PS1 + 3BCG group showed increases in the expression levels of SYN (f) and PSD-95 (g). Data were analyzed by performing Student’s t-test and the results obtained are presented as the mean ± SEM normalized to the matched control. n = 4 per group. *p <.05 and **p <.01 vs. The control group.