
Figures & data
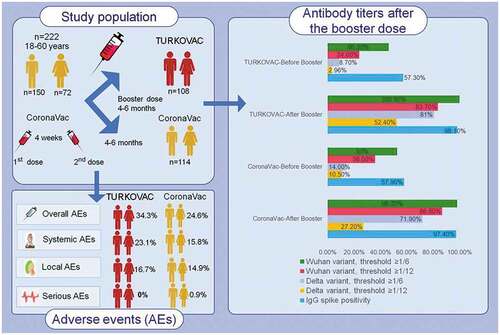
Figure 1. Study flowchart.
†The median time elapsed after vaccination was 21 days (IQR, 13). Of four volunteers, three were males and one was female; the median age was 40.5 years (IQR, 17.25).
Table 1. Characteristics of the study participants.
Figure 2. Neutralizing antibody positivity against the (a) Wuhan and (b) Delta variants, and (c) immunoglobulin G-Spike (IgG-S) positivity before and after booster doses in the two study arms.
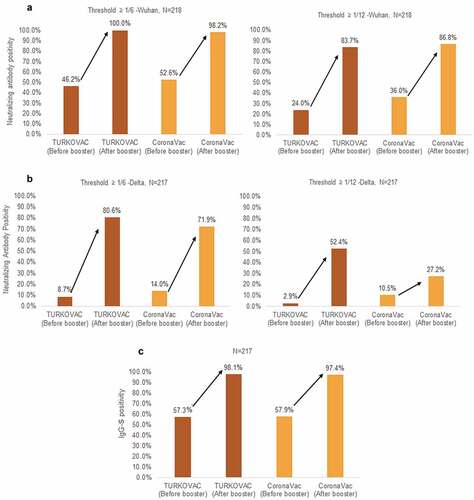
Table 2. Change in spike-specific immunoglobulin G antibody levels before and after the booster doses.
Table 3. Neutralizing antibody geometric mean titer results.
Table 4. Frequency of adverse events in the two study arms.
Supplemental material