
Figures & data
Table 1. KD of murine, chimeric and humanized mAb determined by biolayer interferometry (BLI).
Table 2. Relative affinity of mAb for fentanyl and other target and off-target compounds as determined by competitive ELISA.
Figure 1. In vivo efficacy against fentanyl of murine mAbs. Mice (n=4 per group, 2 males and 2 females) were passively immunized with anti-fentanyl mAb (40 mg/kg, s.c.), and 24 hours later were challenged with 0.25 mg/kg fentanyl. Fentanyl-induced effects on: (a) antinociception measured by hot plate; (b) heart rate and (c) breath rate measured by pulse oximetry. (d) One week after challenge, serum concentration of mAb measured by ELISA. Data are expressed as mean ± SEM; *p≤.05; **p≤.01; ***p≤.001.
Figure 2. In vivo comparison of murine and chimeric anti-fentanyl mAbs. Mice (n=3 male mice per group) were passively immunized with anti-fentanyl mAb (40 mg/kg, s.c.), and 24 hours later were challenged with 0.1 mg/kg fentanyl. Concentration of fentanyl in (a) brain and (b) serum measured by LCMS. (c) Serum concentration of mAb and chAb prior to fentanyl challenge measured by ELISA. Data are expressed as mean ± SEM; *p≤.05; ***p≤.001, ****p≤.0001.
Figure 3. In vivo comparison of murine and chimeric HY6-F9 in rats. Rats (n=3–4 male rats per group) were passively immunized with anti-fentanyl mAb (40 mg/kg, i.p.), and 24 hours later were challenged with 0.1 mg/kg fentanyl. (a) Fentanyl-induced antinociception as latency to respond on a hot plate; (b) oxygen saturation, (c) heart rate, and (d) breath rate measured by pulse oximetry. Concentrations of fentanyl in (e) brain and (f) serum measured by LCMS. Data are expressed as mean ± SEM; *p≤.05; **p≤.01; ***p≤.001.
Table 3. Homology of mAbs to human germline and KD to fentanyl and carfentanil.
Table 4. Biophysical characterization of chimeric and humanized mAb.
Figure 4. Fab Tm comparison of chimeric and humanized mAb. HY6-F9 mAbs (a) and HY11-7E1 mAbs (b) at 1 mg/ml in PBS, pH 7.4 were combined with Protein Thermal ShiftTM assay reagents and subjected to a continuous 0.3% (0.45°C/min) temperature ramp from 25 to 95°C. The Tm of each mAb fragment is determined by the temperature measurement at the derivative peak (dPeak). The initial, broad dPeak in each sample corresponds to the CH2domain, while the second dPeak in each sample corresponds to the Fab domain. All humanized HY6-F9 and HY11-7E1 mAbs show an increased temperature shift in Fab Tm upon humanization, indicating increased thermal stability compared to the murine chimeric counterpart.
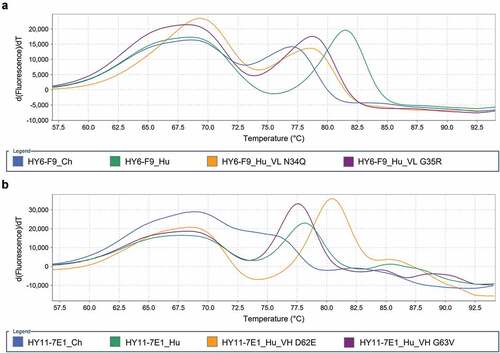
Figure 5. Efficacy of humanized lead mAb in rats. Rats (n=4 male rats per group) were passively immunized with saline, HY6-F9_Ch as positive control, HY6-F9_Hu (NQ), or HY11-7E1_Hu (DE) (40 mg/kg, i.p.), and 24 hours later were challenged with cumulative fentanyl doses up to 0.3 mg/kg. (a) Fentanyl-induced antinociception as latency to respond on a hot plate; (b) oxygen saturation, and (c) heart rate measured by pulse oximetry. (d) Concentration of mAb 1 hour prior to challenge measured by ELISA; and concentrations of fentanyl in (e) serum and (f) brain, and (g) concentration of norfentanyl in serum 15 min after final fentanyl dose measured by LCMS. Data are expressed as mean ± SEM; *, # or † indicate significance of indicated groups vs saline, or bars to indicate significance between groups; [*,#,†]p≤.05; [**,##,††]p≤.01; [***,###,†††]p≤.001; [****,####,††††]p≤.0001.
![Figure 5. Efficacy of humanized lead mAb in rats. Rats (n=4 male rats per group) were passively immunized with saline, HY6-F9_Ch as positive control, HY6-F9_Hu (NQ), or HY11-7E1_Hu (DE) (40 mg/kg, i.p.), and 24 hours later were challenged with cumulative fentanyl doses up to 0.3 mg/kg. (a) Fentanyl-induced antinociception as latency to respond on a hot plate; (b) oxygen saturation, and (c) heart rate measured by pulse oximetry. (d) Concentration of mAb 1 hour prior to challenge measured by ELISA; and concentrations of fentanyl in (e) serum and (f) brain, and (g) concentration of norfentanyl in serum 15 min after final fentanyl dose measured by LCMS. Data are expressed as mean ± SEM; *, # or † indicate significance of indicated groups vs saline, or bars to indicate significance between groups; [*,#,†]p≤.05; [**,##,††]p≤.01; [***,###,†††]p≤.001; [****,####,††††]p≤.0001.](/cms/asset/3ed5e2ec-aac2-4562-991a-acef3b5effeb/khvi_a_2122507_f0005_oc.jpg)