Figures & data
Figure 1. Distribution of responses and proportion reported extreme willingness to receive a COVID-19 vaccine booster by regions.
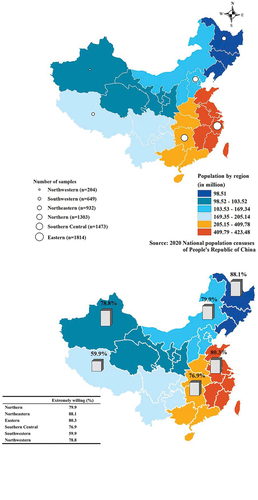
Table 1. Demographic characteristics of study participants and univariate analyses of factors associated with willingness to receive COVID-19 vaccine booster.
Figure 2. Willingness to receive a COVID-19 vaccine booster.
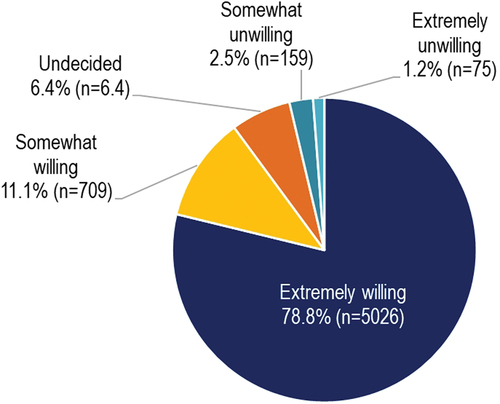
Table 2. Multivariable analysis of factors associated with willingness to receive COVID-19 vaccine booster.