Figures & data
Figure 1. Model structure (reprinted from HIQA, Citation2018)Citation8.
Table 1. Relative risk (RR) of persistent HPV infection after vaccination.
Table 2. Cost data included in the HPV vaccination model.
Table 3. Costs and benefits of HPV vaccination strategies (in relation to vaccination of girls with the 4-valent vaccine). Strategies are sorted by QALYs.
Table 4. Incremental cost-effectiveness ratio (ICER) of the two most effective strategies.
Figure 2. Cost-effectiveness plane of gender-neutral 9-valent strategy in relation to girls-only 9-valent strategy.
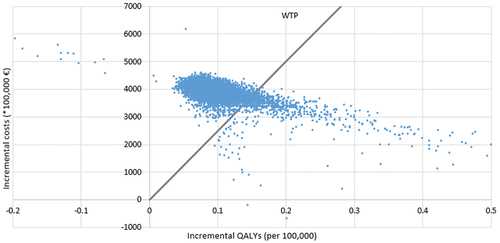
Table 5. Cumulative number of cases averted after changing the HPV immunization strategy.
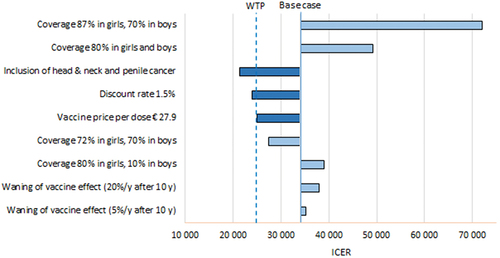
Figure 3. Tornado diagram of the scenario analyses for gender-neutral 9-valent strategy compared to girls-only 9-valent strategy.