Figures & data
Table 1. Subject characteristics.
Table 2. mPLEX-Flu hemagglutinin panel.
Figure 1. Stalk-reactive IgG in human plasma. Plasma was obtained from 13 donors, 12 of which had been previously vaccinated within the past 5 years with seasonal influenza vaccines. Plasma baseline anti-influenza IgG was assessed by mPlex-Flu assay (n = 13). (a) levels of IgG against historic outbreak and recently circulating H3N2 and H1N1 strains. Each column depicts median fluorescence intensity (MFI), representing an individual donor. (b) levels of H7N1-, H7N3- and H7N9-reactive IgG. (c) H1 and H3 stalk-reactive IgG. (d) IgG-binding to cH5/3 and cH4/7 proteins. Each symbol and line represents one donor. Mann-Whitney two-tailed test was used to evaluate the difference among different groups. P < 0.05 was considered statistically significant. This analysis was performed at a 1:5,000 dilution.
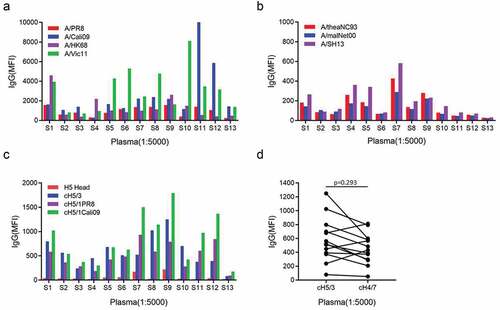
Figure 2. Anti-H7 IgG secretion stimulated by inactivated A/SH13 viruses. Purified B cells from 13 donors were obtained by negative selection and stimulated with CpG2006ODN alone or together with IL-15 and A/SH13 (H7) BPL inactivated virus for 6 days in vitro. Supernatants were collected and the IgG-binding to A/rheaNC93 H7N1 (a), A/malNet00 H7N3 (b) and A/SH13 H7N9 (c) HA were measured. Each symbol and line represents one donor. Mann-Whitney two-tailed test was used to evaluate the difference among different groups. P < 0.05 was considered statistically significant.
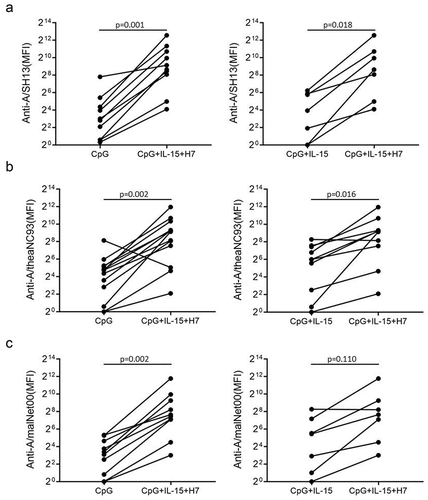
Figure 3. IgG induced by H7N9 viruses in vitro cross-react with A/Vic11 and A/Cali09 HA. Purified B cells were obtained by negative selection and stimulated with CpG2006ODN alone or together with IL-15 and A/SH13 inactivated virus for 6 days. Supernatants were collected, and H1 and H3 HA-reactive IgG were detected using mPlex-Flu assay. (a) levels of IgG against A/SH13 HA. H7-binding antibodies in supernatants of activated B cells were monitored using beads bound with HA from H7N9 strains (n = 13), and compared with CpG+IL-15+H3 group (n = 10). (b) A/Vic11- and (c) A/Cali09-reactive IgG levels in CpG (n = 13), CpG+IL-15 (n = 10) and CpG+IL-15+H7 (n = 10) groups. (d) The levels of H7N9-induced H1, H3 and H7 antibodies were compared. Each symbol represents an individual donor. Mann-Whitney two-tailed test was used to evaluate the difference among different groups. P < 0.05 was considered statistically significant.
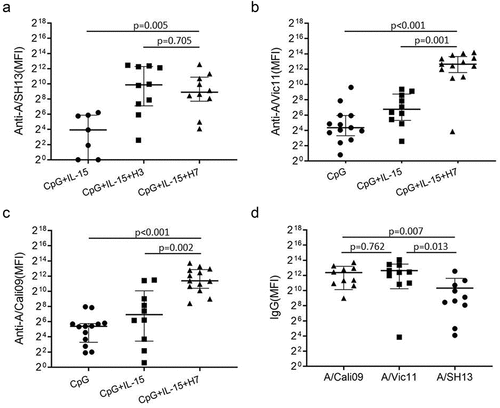
Figure 4. Cross-reactive IgG induced by A/SH13 and CpG2006ODN. B cells were obtained by negative selection, and then stimulated with CpG2006ODN alone or together with A/SH13 for 6 days. Cross-reactive antibodies binding to H1, H2, H5, H6 and H7 subtypes induced in the B cell cultures were measured by mPlex-Flu assay. (a) CpG2006ODN with H7 antigen induces a broad recall response to different influenza strains (n = 13). (b) fold change in cross-reactive antibodies. All values of IgG levels (MFI) were subtracted from the culture medium alone values before calculating fold change (n = 13). Each symbol represents the median of fold change in IgG levels. (c) Comparison between seasonal subtypes and the boosting strain.
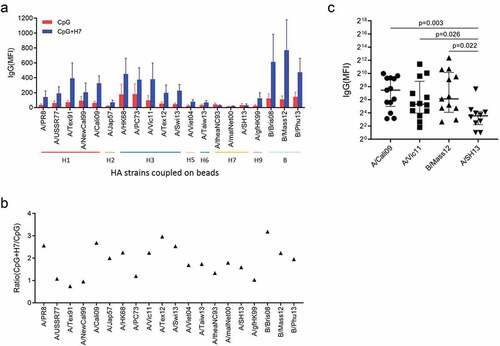
Figure 5. IL-15 enhanced the cross-reactive IgG induced by A/SH13. (a) B cells from 13 donors were stimulated with CpG2006ODN, inactivated A/SH13 viruses and IL-15. Strain-specific and HA stalk-reactive IgG in supernatants of activated B cells were measured after 6 days (n = 13). (b) correlation between influenza specific antibodies and HA antigenic sequence (n = 13). (c) fold change in cross-reactive antibodies (n = 13). IL-15 increased the concentration of anti-HA reactive IgG.
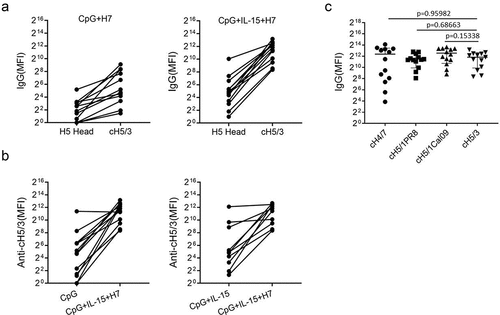
Figure 6. Stalk-reactive IgG induced by A/SH13 viruses. B cells from healthy donors were stimulated with CpG2006ODN alone or together with inactivated A/SH13 (H7N9) viruses and IL-15 in vitro. The levels of IgG against H5 head and cH5/3 were shown for individual subjects. 12 of 13 subjects displayed increases in stalk-reactive IgG after A/SH13 stimulation. (a) levels of IgG binding to H5 head and cH5/3. (b) levels of cH5/3-reactive IgG after stimulation with CpG2006ODN alone or together with inactivated A/SH13 (H7N9) viruses. (c) Comparation between H3- and H1-, H7-reactive antibodies.