
Figures & data
Figure 1. Study selection (PRISMA Flow chart)Citation30.
Figure 2. Study designs of selected randomized controlled trials (N = 3).
ARs: adverse reactions; HAI: hemagglutinin-inhibiting antibodiegglutinin-inhibiting antibodies; IgG: immunoglobulin G; IS: injection site.
Table 1. Description of the safety & immunogenicity studies reviewed.
Figure 3. Proportion of vaccinees reporting at least one adverse reaction at injection site(s) through 7 d following mono or coadministration of influenza and COVID-19 vaccines.
AR: adverse reaction; aTIV: adjuvanted trivalent influenza vaccine; CoAd: coadministration; HD-QIV: high-dose quadrivalent influenza vaccine; QIVc: cellular quadrivalent influenza vaccine; QIVr: recombinant quadrivalent influenza vaccine.
Figure 4. Proportion of vaccinees reporting at least one systemic adverse reaction through 7 d following mono or coadministration of influenza and COVID-19 vaccines.
AR: adverse reaction; C: COVID-19 vaccine; C+I: coadministration of both vaccines; I: influenza vaccine; P: placebo.
*: Means the corresponding vaccine is administered 21 d after C+I for the COVID-19 vaccine and C+P for the influenza vaccine.
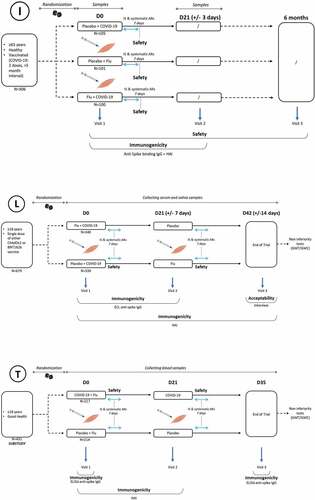
Table 2. Description of the acceptability & acceptance studies reviewed.
Supplemental material