
Figures & data
Figure 1. PRISMA flow diagram.
PRISMA, Preferred Reporting Items for Systematic Literature Reviews and Meta-Analyses.
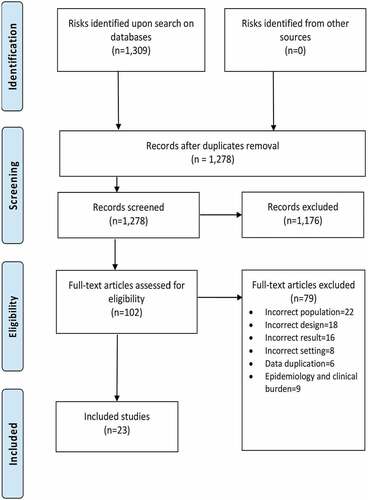
Table 1. Use of resources and costs per patient, as reported in reviewed studies (N = 23). Costs in 2018 international dollars ($).
Table 2. Hospitalizations due to HZ and treatment options.
Figure 2. Meta-analysis of number of days of hospitalization due to HZ in immunocompetent patients ≥65 years of age.
HZ, herpes zoster. References: Vujacich 2016;Citation52 Toniolo-Neto2018;Citation58 Rampakakis 2017.Citation62
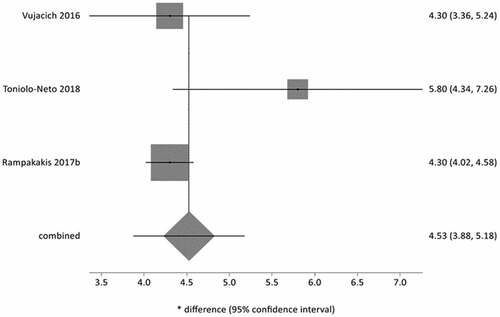
Table 3. Quality evaluation for use of resources and cost studies (n = 8).
Table 4. Brazil. Costs of hospitalizations caused by varicella and HZ in patients ≥65 years of age in the public health system (SUS). Values in International dollars ($)a per year.
Supplemental material