
Figures & data
Figure 1. Schematic of the rotavirus infection and disease model to epidemiological data. Infants may be born with maternal immunity (M) or susceptible (S). Following contact and transmission with an infectious individual, susceptible individuals become exposed (E) and then infectious (I). Recovered individuals (R) are protected from further infection until their immunity wanes, and they once again become susceptible (S). Following successive exposures (denoted as subscripts 1, 2 and 3) individuals have different levels of susceptibility, infectiousness, and protection against disease (see ). Black arrows denote transitions occurring due to infection and loss of immunity. Red arrows denote transitions occurring due to vaccination.
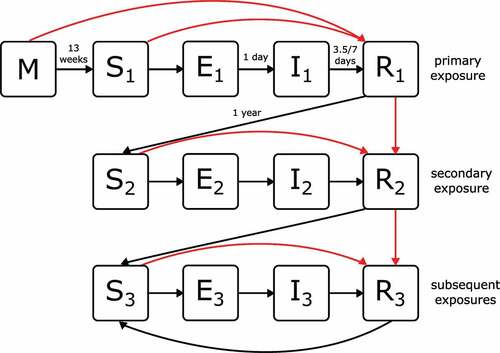
Table 1. Fixed parameter values and sources.
Table 2. Contact rates for non-household contacts.
Table 3. Cumulative vaccine response.
Figure 2. Annual incidence of all rotavirus infections, including asymptomatic infections, by age in the baseline, infant schedule and neonatal schedule scenarios. Incidence values are calculated over a five-year period, five years after the introduction of vaccination. Each boxplot shows the median, IQR and range over 10 simulation runs.
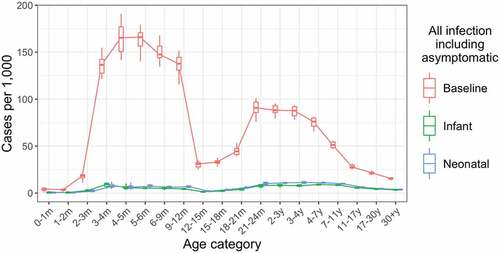
Figure 3. Impact of lower vaccine coverage. Annual incidence of all rotavirus infections, including asymptomatic infections, by age for baseline assumption of 85% vaccine coverage, and alternative moderate (55%) and low (25%) vaccine coverage scenarios. Incidence values are calculated over a five-year period, five years after the introduction of vaccination. Each boxplot shows the median, IQR and range over 10 simulation runs.
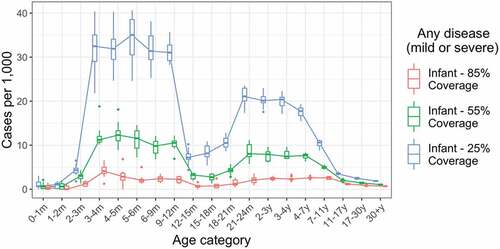
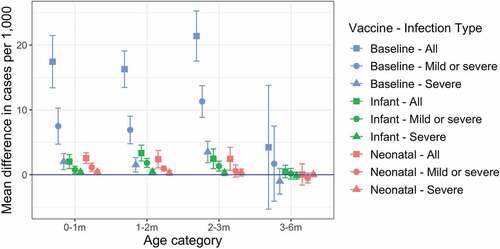
Figure 4. Impact of reduced maternal immunity on annual incidence when the probability of acquiring maternal immunity is halved. Annual incidence of all rotavirus infections, any disease, and severe disease only are shown for the baseline (no vaccination), infant schedule, and neonatal schedule scenarios. Incidence values are calculated over a five-year period, five years after the introduction of vaccination. Each error bar shows the median, 95% CIs over 10 simulation runs.
Supplemental Figures and Tables
Download MS Word (862.7 KB)Data availability
Deidentified group data may be available for sharing on application via the corresponding author. This application must include the relevant proposal detailing the intended use of the data, the ethics approval for this proposal and requires a signed data sharing agreement. Additional study documents including the study protocol, statistical analysis plan and informed consent are available on application via the corresponding author on publication of this report.