
Figures & data
Table 1. Characteristics of study patients included in the immunogenicity analysis.
Table 2. Comparison of the geometric mean concentration (GMC) and GMC ratio of the anti-RBD antibodies among study participants stratified by age, sex, group, and the type of anticancer treatment.
Table 3. Seropositivity and seroprotection among study participants stratified by age, sex, group, and the type of anticancer treatment.
Figure 1. Patient selection flow.
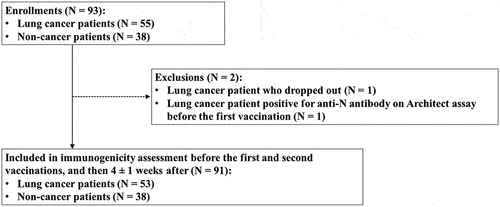
Figure 2. Changes in the anti-RBD antibody titer before vaccination (S0), after first vaccination (S1), and after second vaccination (S2) between non-cancer and lung cancer patients. A red triangle in each box shows the geometric mean titers, whereas the black horizontal line in the middle shows the median of the log-transformed antibody titers. A. Anti-RBD titer on Architect. B. Anti-RBD titer on Elecsys. The GMCs of lung cancer patients were significantly lower than those of the non-cancer patients after the first vaccination (30 vs. 121 AU/mL, p < .001 on Architect; 4.0 vs 1.2 U/mL, p < .001 on Elecsys) and second vaccination (1,632 vs. 3,472 AU/mL, p = .005 on Architect; 213 vs 573 A/mL, p = .002 on Elecsys).
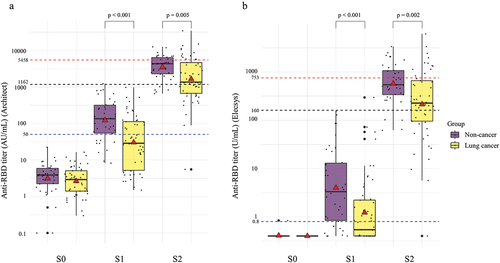
Figure 3. Changes in the anti-RBD antibody titer before vaccination (S0), after first vaccination (S1), and after second vaccination (S2) based on types of anticancer treatment. A red triangle in each box shows the geometric mean titers, whereas the black horizontal line in the middle shows the median of the log-transformed antibody titers. A. Anti-RBD titer on Architect. B. Anti-RBD titer on Elecsys.
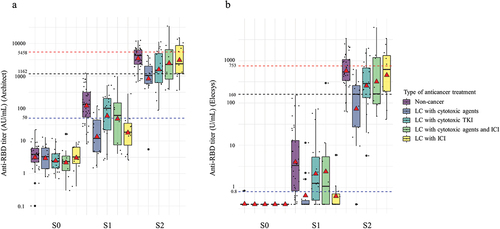
Table 4. Adjusted odds ratios for seropositivity and seroprotection after COVID-19 vaccination in non-cancer patients and lung cancer patients.
Table 5. Adverse reactions to the BNT162b2 COVID-19 vaccination.