
Figures & data
Figure 1. Study design and patient distribution flow chart.
Table 1. Patient characteristics.
Figure 2. Kaplan-Meier curves of survival outcomes of patients in the overall population. (A) Overall survival. (B) Progression-free survival.
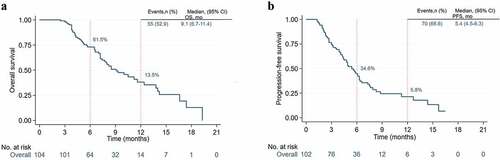
Figure 3. Swimmer’s plot illustrating times of response and disease progression and durations of response and survival for patients. (a) Patients of complete response and partial response. (b) Patients with stable disease.
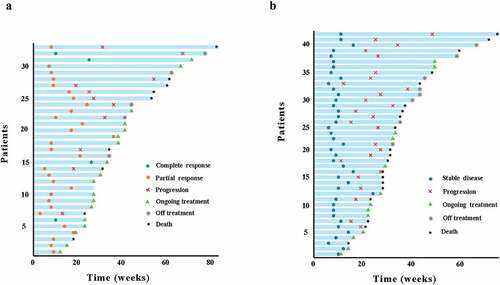
Table 2. Activity of immunotherapy in patients with APC in overall population.
Figure 4. Kaplan-Meier curves of ICIs plus chemo/target/vaccine with or without radiotherapy in the overall population. (a) Overall survival. (b) Progression-free survival.
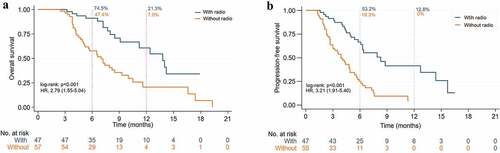
Figure 5. Kaplan-Meier curves of ICIs plus chemo/target/vaccine with or without radiotherapy in recurrent and metastasis pancreatic cancer patients. (A) Overall survival. (B) Progression-free survival.
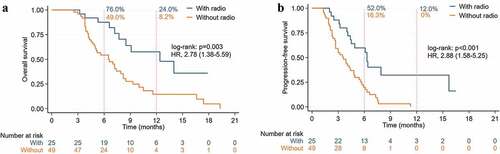
Table 3. Activity of immunotherapy in patients with APC in subgroup analysis.
Figure 6. Kaplan-Meier curves of ICIs combined chemo or targeted or vaccine in the overall population. (a) Overall survival. (b) Progression-free survival.
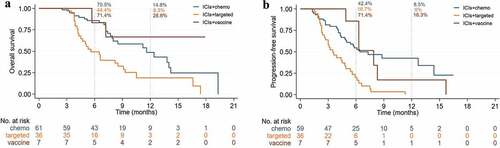
Figure 7. Kaplan-Meier curves of ICIs combined chemo or targeted in recurrent and metastasis pancreatic cancer patients. (a) Overall survival. (b) Progression-free survival.
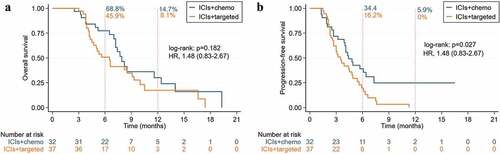
Figure 8. Kaplan-Meier curves of ICIs with different lines in the overall population. (A) Overall survival. (B) Progression-free survival.
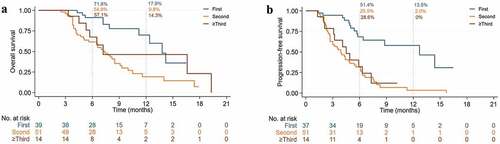
Figure 9. Kaplan-Meier curves of ICIs with PD-L1 expression positive and negative in the overall population. (a) Overall survival. (b) Progression-free survival.
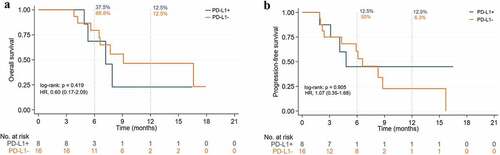
Figure 10. Kaplan-Meier curves of ICIs with TMB-H and TMB-L in the overall population. (a) Overall survival. (b) Progression-free survival.
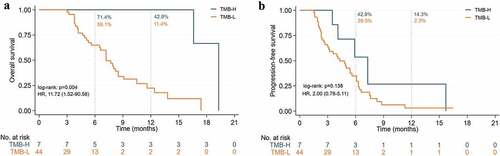
Figure 11. Kaplan-Meier curves of ICIs with TMB-H and TMB-L in recurrent and metastasis pancreatic cancer patients. (a) Overall survival. (b) Progression-free survival.
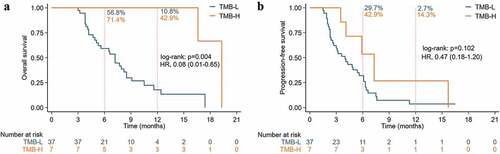
Table 4. Activity of immunotherapy in patients with APC in PD-L1 protein expression and TMB.
Table 5. Treatment-related adverse events occurring in ≥1% of patients.