Figures & data
Figure 1. Demographics of participants in COVID-19 testing at CEHC (N = 4,498).
Note: * Uninsured under 65 years of age
Figure 2. CEHC patients had higher test positivity rates than the city of Providence. Monthly testing rate and positivity are shown for Providence and the clinic.
Note: Number of tests completed (bars) and rate of positive tests (dots) by month.
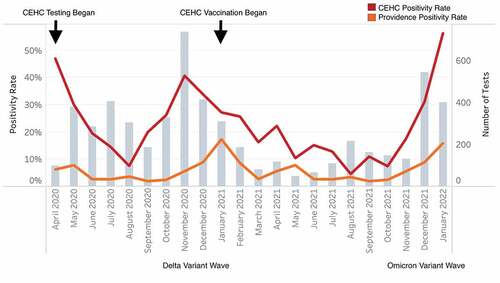
Figure 3. ZIP codes of individuals participating in COVID-19 testing at CEHC.
Note: Number of tests completed by patients living in each ZIP code (displayed for ZIP codes with >50 tests).
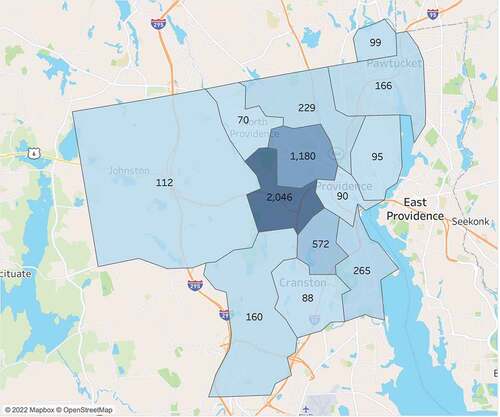
Figure 4. Vaccines administered by Clinica Esperanza/hope clinic volunteers and staff.
Note: Numbers and characteristics of doses of vaccine administered from 2/18/2021 through 1/31/2022. Data includes first, second, third, and booster doses. Total number of vaccine doses administered =15,783 for the study time period.
Figure 5. Vaccination rates at Clinica Esperanza/hope clinic’s test to treat site.
Note: Vaccination and booster status for patients who were tested on or after 7/1/2021 through 1/31/2022. Data provided for N=1,469 subjects.