
Figures & data
Figure 1. PRISMA flow chart displays the article selection process for vaccination dropout in Sub-Saharan Africa.
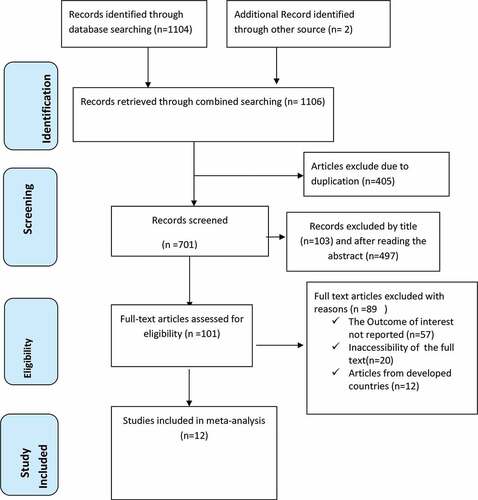
Table 1. Characteristics of the included studies in the systematic review and meta-analysis for the prevalence of vaccination dropout in Sub-Saharan Africa.
Figure 2. Forest plot displaying the pooled prevalence of vaccination dropout in Sub-Saharan Africa.
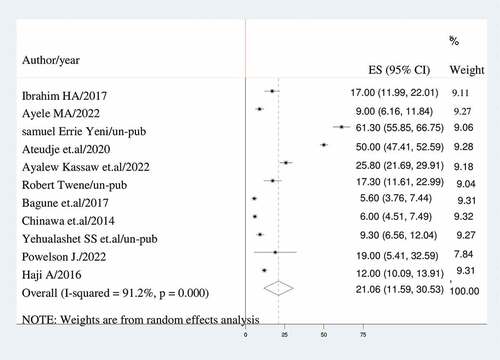
Figure 3. Forest plot displaying sub-group analysis based on the country where the study was done.
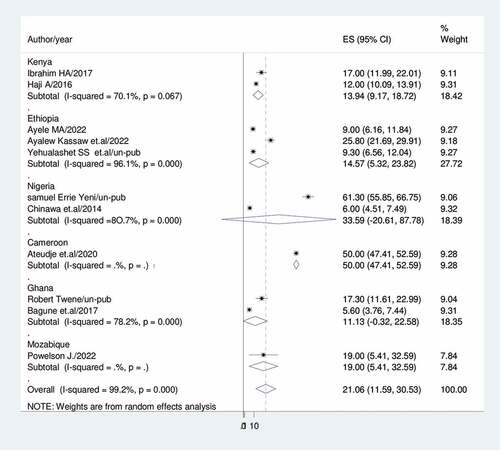
Figure 4. Forest plot displaying sub-group analysis based on study setting.
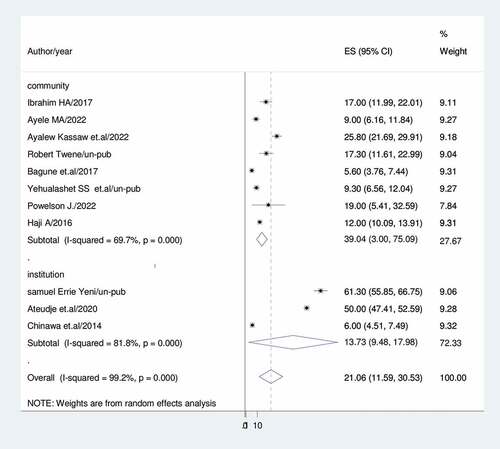
Figure 5. Forest plot displaying sub-group analysis based on the sample size.
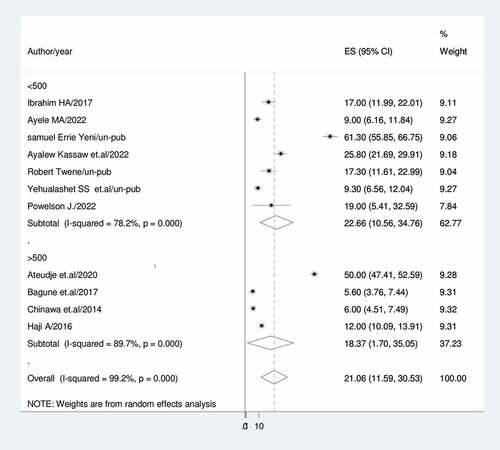
Figure 6. Forest plots display a sub-group analysis based on the publication.
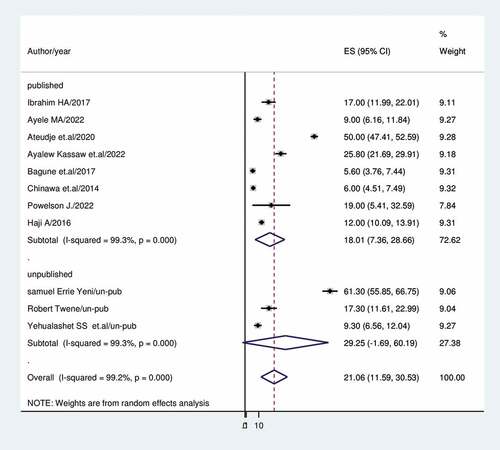
Table 2. Meta-regression analysis of factors affecting between-study heterogeneity.
Figure 7. Forest plot displaying the asymmetrical distribution of the included studies.
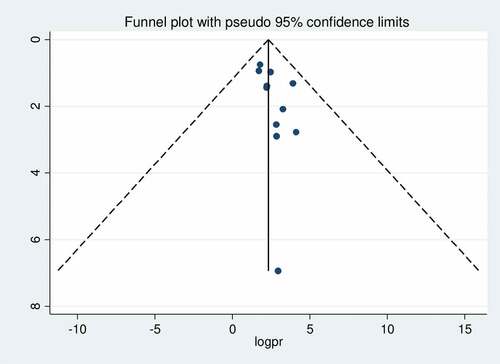
Table 3. The pooled prevalence of vaccination dropout in Sub-Saharan Africa when one study omitted from the analysis a step at a time.
Data availability statement
All relevant data are within the Manuscript and its Supporting Information files.