Figures & data
Table 1. Demographic data of the subjects included in the study – cohort HDM-AIT and HDM non-AIT.
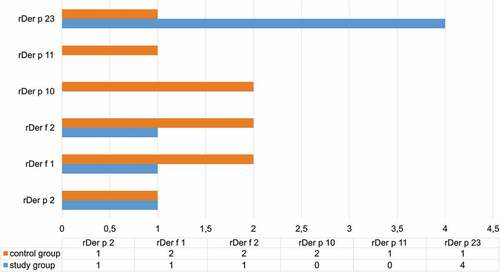
Table 2. Frequency of sensitization to specific HDM molecules in the study group and the control group.
Figure 1. Number of IgE sensitization to 9 allergens (extracts and molecules) in the whole study population (N = 86).
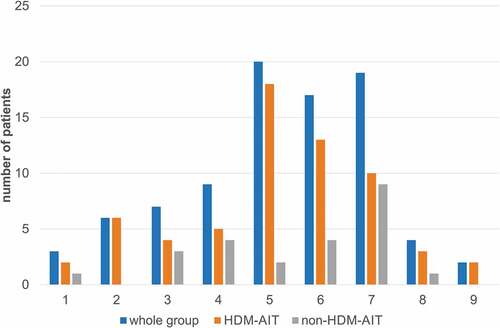
Figure 2. sIge levels against the extract of Dermatophagoides pteronyssinus after 6 and 12 months in the HDM AIT study group.
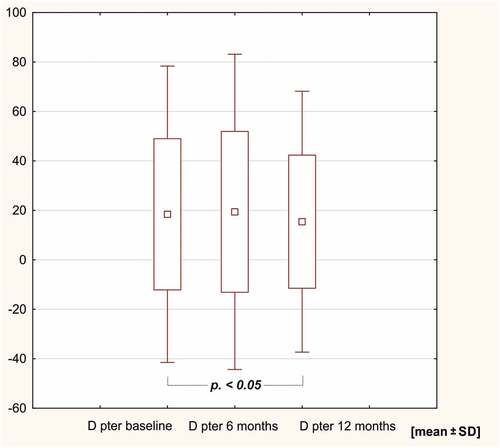
Figure 3. sIge levels against the extract of Dermatophagoides farinae after 6 and 12 months in the HDM AIT study group.
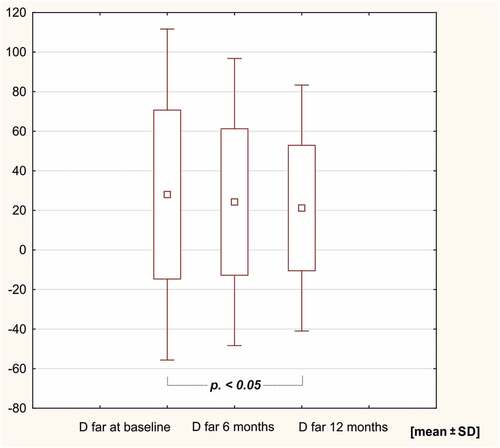
Figure 4. sIge levels against rDer p 1 after 6 and 12 months in the HDM AIT study group.
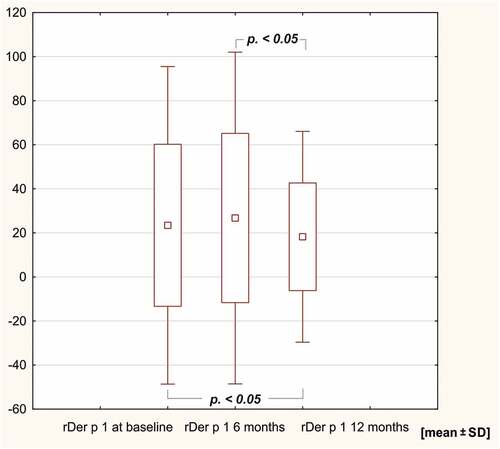
Figure 5. sIge levels against rDer p 2 and rD far 2 after 6 and 12 months of HDM AIT (HDM-AIT study group).
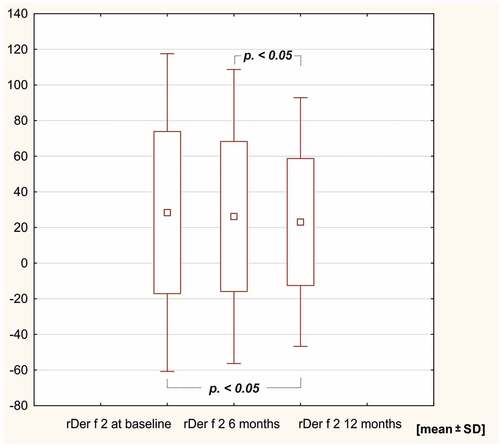
Table 3. sIge levels against HDM extract and specific HDM molecules at baseline, after 6 months and after 12 months of study.
Figure 6. Neosensitizations in the HDM-AIT study group and in the HDM non-AIT control group during 12 months of observation.