Figures & data
Figure 1. Virus neutralization (VN) titers to SARS-CoV-2 virus after 2 doses of mRNA vaccine in correctional officers and inmates. Panel a: VN titers against Wuhan strain in correctional officers; Panel b: VN titers against Wuhan strain in inmates; Panel c: VN titers against Wuhan and Alpha, Beta, Gamma, and Omicron BA.1 variants in correctional officers; Panel d: VN titers against Wuhan and Alpha, Beta, Gamma, and Omicron BA.1 variants in inmates. Dot plots show individual values. Tukey boxplots show outlier values (dots), medians (middle line), third and first quartiles (boxes), while the whiskers display the minimum and maximum values. Horizontal dashed line represents the Lower Limit of Quantification (LLOQ) of VN assay. Statistically significant differences were analyzed by Friedman and Dunn’s multiple comparisons test (p < .05).
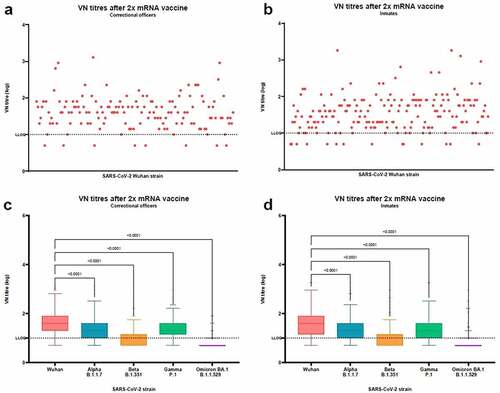
Table 1. Fold decrease in virus neutralization titers to SARS-CoV-2 variants with respect to Wuhan strain in correctional officers, by variant.
Table 2. Fold decrease in virus neutralization titers to SARS-CoV-2 variants with respect to Wuhan strain in inmates, by variant.
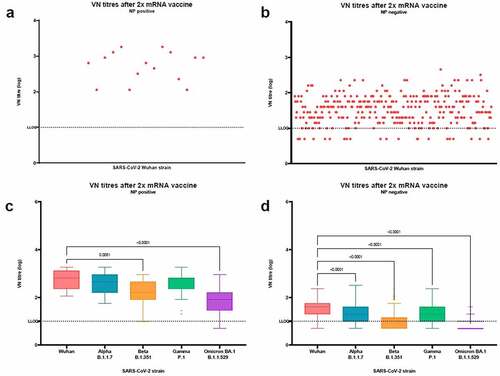
Figure 2. Virus neutralization (VN) titers to SARS-CoV-2 virus after 2 doses of mRNA vaccine in nucleoprotein (NP) positive and NP negative subjects. Panel a: VN titers against Wuhan strain in NP positive subjects; Panel b: VN titers against Wuhan strain in NP negative subjects; Panel c: VN titers against Wuhan and Alpha, Beta, Gamma, and Omicron BA.1 variants in NP positive subjects; Panel d: VN titers against Wuhan and Alpha, Beta, Gamma, and Omicron BA.1 variants in NP negative subjects. Dot plots show individual values. Tukey boxplots show outlier values (dots), medians (middle line), third and first quartiles (boxes), while the whiskers display the minimum and maximum values. Horizontal dashed line represents the Lower Limit of Quantification (LLOQ) of VN assay. Statistically significant differences were analyzed by Friedman and Dunn’s multiple comparisons test (p < .05).