
Figures & data
Figure 1. Cohort of adults immunized with Covaxin (BBV152) in Pune, India and their follow up during June 2021 – March 2022.
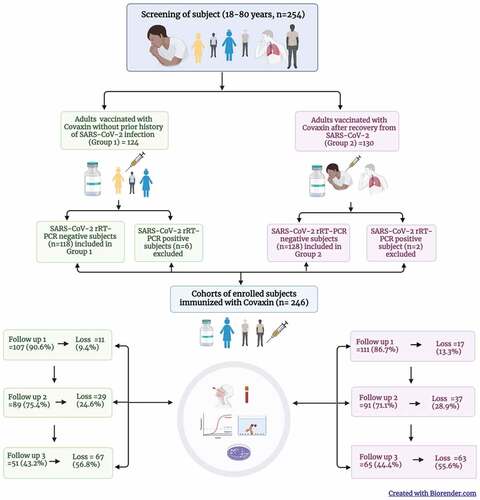
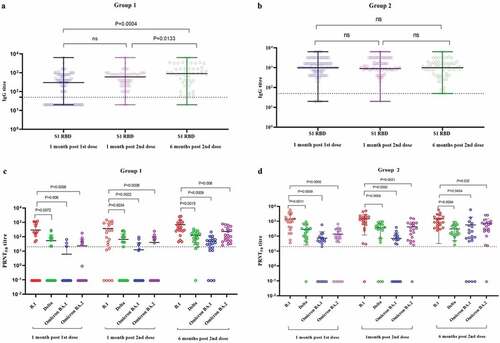
Figure 2. The S1-RBD IgG antibody titer of the sera of study subjects at one month post first dose, 1 month post second dose, and 6 months post second dose from a) Group 1 (COVID-19 naïve individuals) and b) Group 2 (COVID-19 recovered individuals) vaccinated with two doses of Covaxin. The neutralizing antibody titer of sera of study subjects at second dose, 1 month post second dose, and 6 months post second dose from c) Group 1 and d) Group 2 against SARS-CoV-2 B.1, Delta, Omicron BA.1 and BA.2 variants. Differences across time points, categories, ELISA and SARS-CoV-2 variants were analyzed using paired t-tests; p-value less than 0.05 were considered to be statistically significant. The dotted line on the figures indicates the limit of detection of the assays. The data is presented as mean value ± standard deviation. All the analyses were performed using GraphPad PRISM version 9.0.
Supplemental Material
Download MS Word (13.7 KB)Data availability statement
All relevant data are within the manuscript.