
Figures & data
Figure 1. Flow diagram for enrolling 3–24-month-olds with radiological pneumonia admitted into the three sites (Pre-PCV 10 vaccine introduction period).
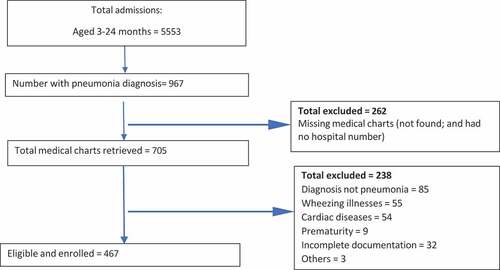
Figure 2. Flow diagram for enrolling 3–24-month-olds with radiological pneumonia admitted into the three sites (post-PCV 10 introduction period).
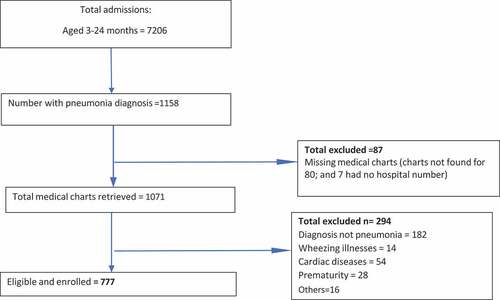
Table 1. Total admissions of 3–24-month-olds pre-PCV 10 and post-PCV 10 introduction periods.
Table 2. Proportions of hospitalized children aged 3–24 months with pneumonia per hospital by year of observation.
Table 3. Crude and adjusted proportions of pneumonia hospitalization at the three hospitals during pre- and post-PCV-10 introduction periods.
Table 4. Pneumonia admissions stratified into two age groups at the three sites during the pre-PCV 10 and post-PCV 10 introduction periods.
Table 5. Vaccination history, pneumonia admissions and outcome in each of the three teaching hospitals during the pre-PCV 10 and post-PCV 10 introduction periods.
Table 6. Case fatality rates among 3–24-month-olds admitted with pneumonia in each of the three teaching hospitals during the pre- and post-PCV 10 introduction periods.