
Figures & data
Figure 1. The enrollment of infections and close contacts in two outbreaks from March to May 2022 in Quzhou, China.
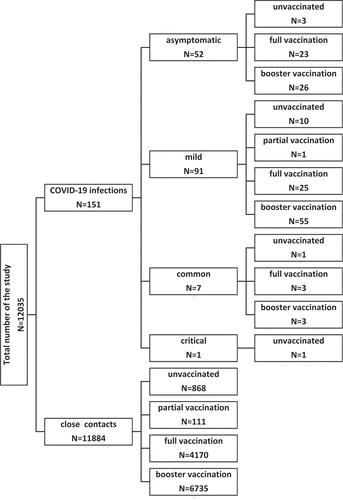
Table 1. The definition of vaccination status according to the technical vaccination recommendations for COVID-19 vaccines in China (First Edition).
Table 2. Vaccine effectiveness for partial, full, and booster immunization with COVID-19 vaccines by age group and virus type during two outbreaks in Quzhou, China.
Figure 2. Cox proportional-hazard regression curves among immune population in COVID-19 outbreaks of SARS-CoV-2 Omicron variant in Quzhou, China.
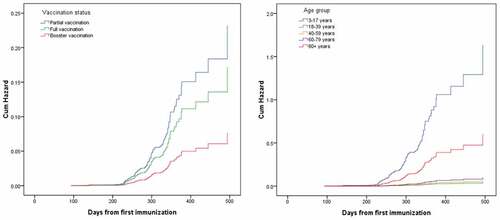
Table 3. The relative risk and results of Cox proportional-hazard regression model among immune population in COVID-19 outbreaks of SARS-CoV-2 Omicron variant in Quzhou, China.
Data availability statement
The data that support the findings of this study are available from the corresponding author on reasonable request .