
Figures & data
Table 1. Demographic profiles and vaccination behavior.
Table 2. Vaccine hesitancy and actual uptake stratified by demographic profiles.
Table 3. Perceived risk, perceived benefit and actual uptake stratified by demographic profiles.
Table 4. Indexes of model fitness for the structural equation model.
Figure 1. Knowledge on influenza and influenza vaccination (p < .001).
Note: aSubjects who had never heard of the influenza vaccine were not included in the analysis; bThe guardians of children aged less than six months were not included.
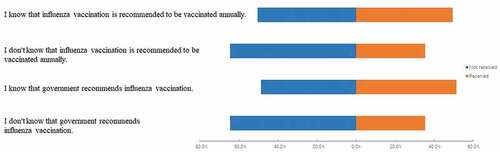
Figure 2. Social influence on influenza vaccination (p < .001).
Note: aSubjects who had never heard of the influenza vaccine were not included in the analysis; bThe guardians of children aged less than six months were not included.
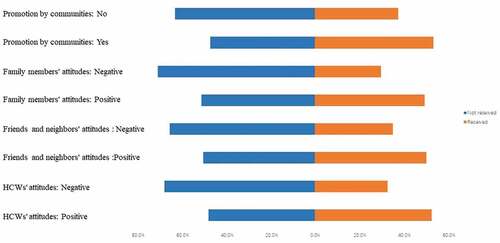
Figure 3. The effects of social influence and relative knowledge on influenza vaccination (p<.001).
Table 5. Path diagram of knowledge, social influence, perceived benefit, perceived risk, perceived barrier, vaccine hesitancy and influenza vaccination.