
Figures & data
Figure 1. Plain language summary.
Figure 2. ZONA IC model structure and analysis framework.
HZ = herpes zoster; IC = immunocompromised; PHN = postherpetic neuralgia; ZONA = ZOster ecoNomic Analysis.
Vaccination may or may not occur in the no HZ health state, depending on the modeled strategy.
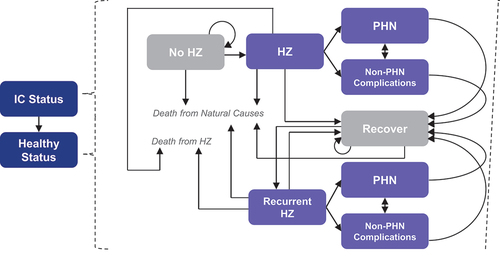
Figure 3. Number needed to vaccinate to avoid one HZ case and one PHN case, by population.
HSCT = hematopoietic stem cell transplant; HZ = herpes zoster; IC = immunocompromised; NNV = number needed to vaccinate; PHN = postherpetic neuralgia.
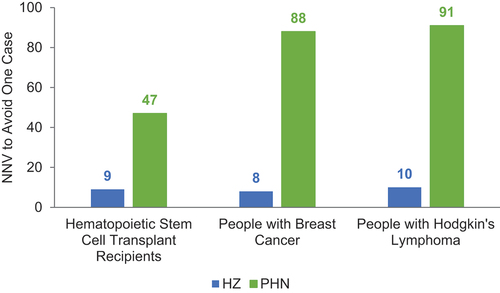
Table 1. Results for selected cancer populations vaccinated with RZV versus no vaccine.
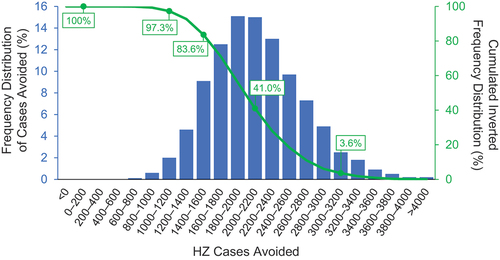
Figure 4. Probabilistic sensitivity analysis for HSCT population.
HSCT = hematopoietic stem cell transplant; HZ = herpes zoster.
Supplemental material