
Figures & data
Figure 1. Construction of ZWY2-based recombinant M.smegmatis strains displaying the S and N on the surface. (a) Schematic illustration of the integration process of recombinant pI1818 plasmid into the M. smegmatis chromosome, and then the fused S protein with the transportation protein of the truncated PE_PGRS33 was located onto the cell surface. The attB is the Mycobacteriophage L5 integrase(int) recognition site located near the tRNAGly in the mycobacterium’s genome. The attP is the attachment site on Mycobacteriophage’s genome. After the integration, the fused protein was expressed and translocated to the cell wall through the PE domain of the truncated PE_PGRS33 protein. (b) Identification of ZWY2-based recombinant mycobacterial strains using FX and pF1 primers (Table S1). The FX is located in the gene HygR in the integrative plasmid, and the pF1 is located upstream of the attB site in the M. smegmatis genome. Lane1: DNA marker; Lane 2: ZWY2-S; Lane 3: ZWY2-S-HA; Lane 4: ZWY2-N; Lane 5: ZWY2-N-HA; NC: negative control (ZWY2). (c) Western blotting analysis of the subcellular fractions of ZWY2-S-HA and ZWY2-N-HA. WCL: whole cell lysate; CW: cell wall; CP: cell plasma; NC: negative control (the cell wall of ZWY2).
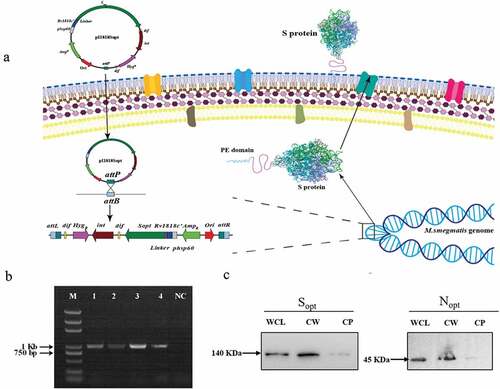
Figure 2. Recombinant M. Smegmatis-based vaccine could induce the activation and maturation of antigen-presenting cells. (a) the expression level of co-stimulatory molecules on Raw264.7 and DC 2.4 cells after being infected with ZWY2-S or ZWY2-N bacteria. The red peak represents the medium control group, and the blue one represents the recombinant M. smegmatis treated group. (b) the mRNA levels of IFN-β, TNF-α, IL-6, and IL-1β in Raw264.7 and DC2.4 cells after being infected with ZWY2-S or ZWY2-N. These data were expressed as the mean ± SEM from two individual trials (*: P < .05; **: P < .01; ***: P < .001).
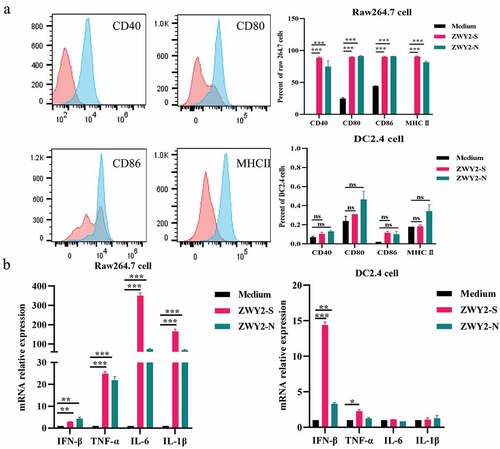
Figure 3. SARS-CoV-2 antigen-specific T-cellular immune responses were elicited by the recombinant ZWY2-S and ZWY2-N in mice. (a) Schedule for vaccination and the immunogenicity detecting procedure in mice. Six-week-old BALB/c mice were vaccinated with PBS, ZWY2, ZWY2-S, and ZWY2-N using the indicated dosage through a subcutaneous route. The symbols of red blood drops indicate the time points for collecting the serum samples. At 6 weeks and 9 weeks after the initial vaccination, five mice in each group were sacrificed, and the splenocytes were harvested and subjected to the following immunological assays. (b) at week 6, SARS-CoV-2 S or N antigen-specific T cell immune responses were detected using IFN-γ ELISpot assays following stimulation with the corresponding peptide pools. SFCs: spot-forming cells. (c) Gating strategy to analyze the frequency of CD4+ T and CD8+ T cells secreting the IFN-γ, TNF-α, IL-2 cytokines, and expressing CD107a marker by ICS assay. Column graphs depict the frequency of cytokine-positive CD4+ T cells and CD8+ T cells, which is calculated by subtracting the mock-stimulated sample at week 6 (d) and week 9 (e). Two independent experiments for animal immunization were repeated. The frequency of antigen-specific cytokine-positive T cell ratio These data were expressed as the mean ± SEM (*: P < .05; **: P < .01; ***: P < .001).
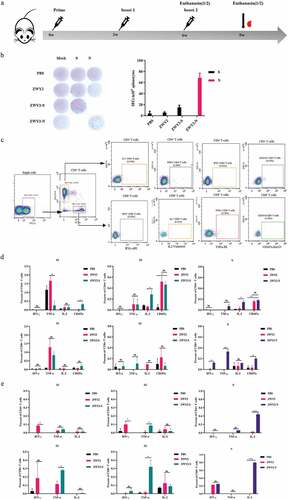
Figure 4. The central memory T subsets were induced by recombinant ZWY2-S and ZWY2-N in mice. (a) Gating strategy for analyzing the percentage of different T cell subsets, including Tcm (Cd44high CD62 L+), Tem (Cd44high CD62 L-) of CD4+ T cells, and CD8+ T cells. (b) Column graphs of the different cell subsets percentage of CD4+ T cells and CD8+ T cells. Two independent experiments for animal immunization were repeated. These data were expressed as the mean ± SEM (*: P < .05; **: P < .01; ***: P < .001).
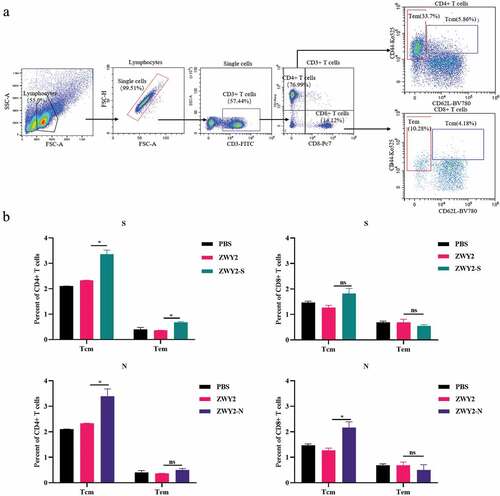
Table 1. The cross-epitope between SARS-CoV-2 and M. smegmatis.