Figures & data
Table 1. Patients’ characteristics.
Figure 1. Progression free survival of patients in first (a) and second/third line setting (b).
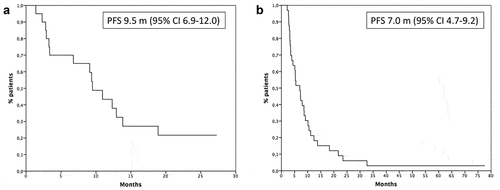
Figure 2. Survival of patients with clinical benefit (solid line) or progression (dashed line). CR: complete response, PR: partial response; SD: stable disease; PD: progression of disease.
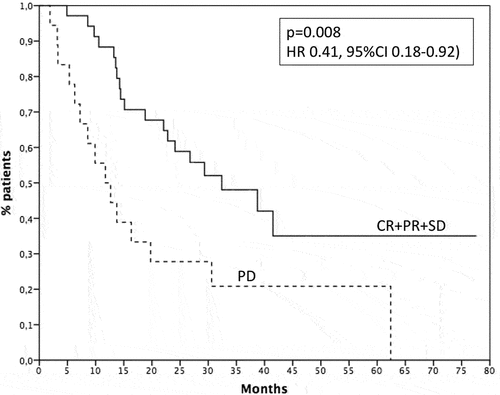
Figure 3. Survival of patients with clinical benefit (solid line) or progression (dashed line) in first (A) and second/third line setting (B). CR: complete response, PR: partial response; SD: stable disease; PD: progression of disease.
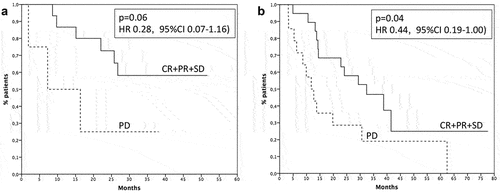
Table 2. Response rate.
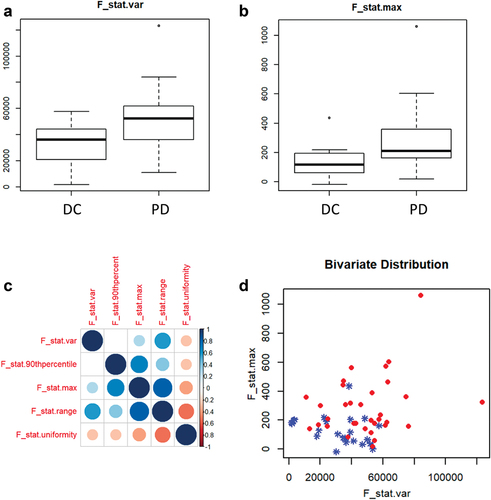
Figure 4. a–b: the boxplots represent the distribution of F_stat_var and F_stat.Max between the two cohorts (DC: patients with disease control; PD: patients with progression of disease). c: Pearson correlation coefficients between the most significant features. d: the distribution of the cases (patients with disease control in blue, patients with progression of disease in red) in a space built with F_stat.Var on the x-axis and F_stat.Max on the y-axis.