
Figures & data
Table 1. Education and income level in the adult population in Norway, by demographic and health-related variables.
Table 2. Regression analysesa for completion of primary vaccination (≥ 2 doses) and booster vaccination (≥ 3 doses) against COVID-19 by sociodemographic and health characteristics among individuals 18–44 y of ageb.
Table 3. Regression analysesa for completion of primary vaccination (≥ 2 doses) and booster vaccination (≥ 3 doses) against COVID-19 by sociodemographic and health characteristics among individuals ≥ 45 y of ageb.
Figure 1. COVID-19 vaccination coverage for ≥ 2 doses (red bars) and ≥ 3 doses (blue bars), by highest attained education level. (a) Vaccination coverage (%) for individuals aged 18–44 y. (b) Vaccination coverage (%) for individuals aged ≥ 45 y.
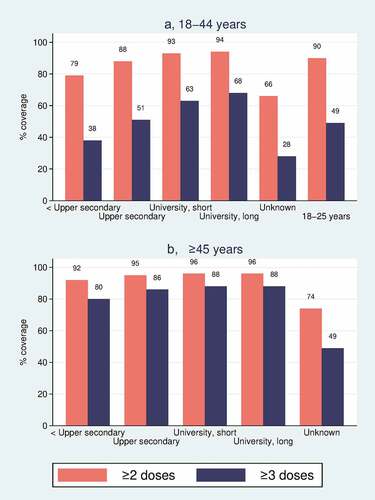
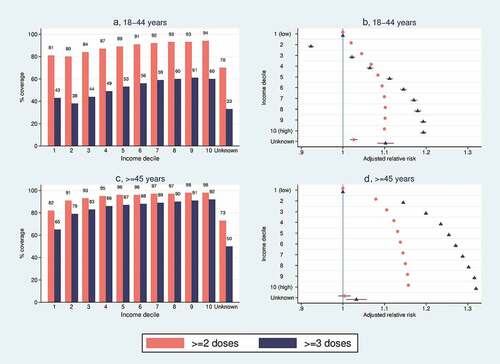
Figure 2. COVID-19 vaccination coverage for ≥ 2 doses (red bars/circles) and ≥ 3 doses (blue bars/triangles), by household income level. (a) Vaccination coverage (%) for individuals aged 18–44 y. (b) Adjusted relative risks for vaccination with associated 95% confidence intervals among individuals aged 18–44 y. (c) Vaccination coverage (%) for individuals aged ≥ 45 y. (d) Adjusted relative risks for vaccination with associated 95% confidence intervals among individuals aged ≥ 45 y.
Supplemental Material
Download PDF (328.4 KB)Data availability statement
The data contains personal information and data access is only possible by ethics committee approval and appropriate application to the public registries used in this study. Further information is available from the corresponding author upon request.