
Figures & data
Figure 1. Participant disposition. One participant in the mRNA-1273 100-µg group discontinued vaccination because of an adverse event, which was considered related to study vaccination. All randomly assigned participants who received dose 1 of the study vaccination were included in the safety population. Reasons for exclusion from the per-protocol immunogenicity population are described in the Supplement. Abbreviation: mRNA, messenger RNA.
Table 1. Participant baseline demographics (safety population).
Figure 2. Solicited (a) local and (b) systemic adverse reactions within 7 days of each dose. Percentages are based on participants in the solicited safety population, consisting of all randomly assigned participants receiving ≥1 dose and contributing any solicited adverse reaction data. Number of participants in the dose 1 solicited safety population: mRNA-1283 10 µg, n = 21; mRNA-1283 30 µg, n = 22; mRNA-1283 100 µg, n = 21; placebo + mRNA-1283 100 µg, n = 18; and mRNA-1273 100 µg, n = 22. Number of participants in the dose 2 solicited safety population: mRNA-1283 10 µg, n = 19; mRNA-1283 30 µg, n = 20; mRNA-1283 100 µg, n = 21; placebo + mRNA-1283 100 µg, n = 15; and mRNA-1273 100 µg, n = 20. Abbreviation: mRNA, messenger RNA.
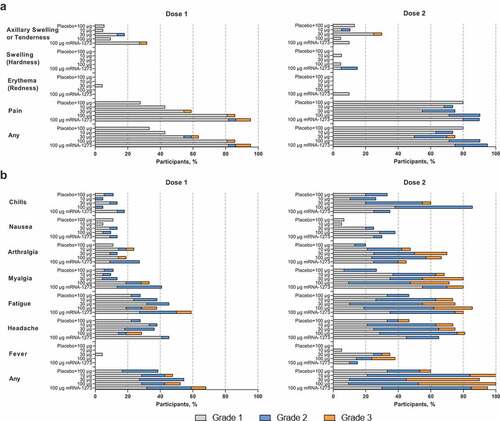
Table 2. Summary of unsolicited TEAEs through 28 days following any vaccination (safety population).
Figure 3. Pseudovirus neutralizing antibody ID50 titers against (a) Wuhan-Hu-1 (with D614G mutation) SARS-CoV-2 or (b) B.1.351 variant through day 57. Neutralizing antibody titers on the pseudovirus neutralization assay at ID50 (log scale) are shown for those participants in the per-protocol immunogenicity population. In both panels, boxplots are based on log-transformed values; boxes and horizontal bars denote IQR range and ID50, respectively, with whisker end points equal to the values below or above the median at 1.5 times the IQR. Dots represent individual results and the dotted lines represent either the LLOQ or ULOQ. Antibody values reported as below the LLOQ were replaced by 0.5 × LLOQ, whereas values greater than the ULOQ were converted to the ULOQ if the actual values were unavailable. In panel a, the LLOQ was 18.5 (log10[LLOQ] = 1.267) and the ULOQ was 45,118 (log10[ULOQ] = 4.654). In panel b, the LLOQ was 19.5 (log10[LLOQ] = 1.290) and the ULOQ was 385.7 (log10[ULOQ] = 2.586).
![Figure 3. Pseudovirus neutralizing antibody ID50 titers against (a) Wuhan-Hu-1 (with D614G mutation) SARS-CoV-2 or (b) B.1.351 variant through day 57. Neutralizing antibody titers on the pseudovirus neutralization assay at ID50 (log scale) are shown for those participants in the per-protocol immunogenicity population. In both panels, boxplots are based on log-transformed values; boxes and horizontal bars denote IQR range and ID50, respectively, with whisker end points equal to the values below or above the median at 1.5 times the IQR. Dots represent individual results and the dotted lines represent either the LLOQ or ULOQ. Antibody values reported as below the LLOQ were replaced by 0.5 × LLOQ, whereas values greater than the ULOQ were converted to the ULOQ if the actual values were unavailable. In panel a, the LLOQ was 18.5 (log10[LLOQ] = 1.267) and the ULOQ was 45,118 (log10[ULOQ] = 4.654). In panel b, the LLOQ was 19.5 (log10[LLOQ] = 1.290) and the ULOQ was 385.7 (log10[ULOQ] = 2.586).](/cms/asset/1e9d0855-eabd-44db-84de-7aba72fb1f0c/khvi_a_2190690_f0003_oc.jpg)
Figure 4. Binding antibody levels through day 57 specific to Wuhan-Hu-1 SARS-CoV-2 (a) S protein, (b) RBD, or (C) NTD Binding IgG antibody levels by MSD 4-PLEX assay are shown for those participants in the per-protocol immunogenicity population. Boxplots are based on log-transformed values; boxes and horizontal bars denote IQR range and GM, respectively, with whisker end points equal to the values below or above the median at 1.5 times the IQR. Individual results are represented as dots and the dotted lines represent either the LLOQ or ULOQ. Antibody values reported as below the LLOQ were replaced by 0.5 × LLOQ, whereas values greater than the ULOQ were converted to the ULOQ if actual values were unavailable. In panel a, the LLOQ was 23 (log10[LLOQ] = 1.362) and the ULOQ was 14,000,000 (log10[ULOQ] = 7.146). In panel b, the LLOQ was 19 (log10[LLOQ] = 1.279) and the ULOQ was 6,000,000 (log10[ULOQ] = 6.778). In panel c, the LLOQ was 3 (log10[LLOQ] = 0.477) and the ULOQ was 200000 (log10[ULOQ] = 5.301).
![Figure 4. Binding antibody levels through day 57 specific to Wuhan-Hu-1 SARS-CoV-2 (a) S protein, (b) RBD, or (C) NTD Binding IgG antibody levels by MSD 4-PLEX assay are shown for those participants in the per-protocol immunogenicity population. Boxplots are based on log-transformed values; boxes and horizontal bars denote IQR range and GM, respectively, with whisker end points equal to the values below or above the median at 1.5 times the IQR. Individual results are represented as dots and the dotted lines represent either the LLOQ or ULOQ. Antibody values reported as below the LLOQ were replaced by 0.5 × LLOQ, whereas values greater than the ULOQ were converted to the ULOQ if actual values were unavailable. In panel a, the LLOQ was 23 (log10[LLOQ] = 1.362) and the ULOQ was 14,000,000 (log10[ULOQ] = 7.146). In panel b, the LLOQ was 19 (log10[LLOQ] = 1.279) and the ULOQ was 6,000,000 (log10[ULOQ] = 6.778). In panel c, the LLOQ was 3 (log10[LLOQ] = 0.477) and the ULOQ was 200000 (log10[ULOQ] = 5.301).](/cms/asset/380a79d5-641b-40e6-b591-f1d148917bd7/khvi_a_2190690_f0004_oc.jpg)