Figures & data
Figure 1. Map of the recombinant plasmid pNMM vaccine and expression pattern of control plasmids.
(a) A schematic diagram of the plasmid pNMM vaccine. (b) Expression pattern of the fusion gene and costimulatory molecules (pNMM). (c) Expression pattern of the control adjuvant plasmids. (d) Expression pattern of the control antigen plasmids.
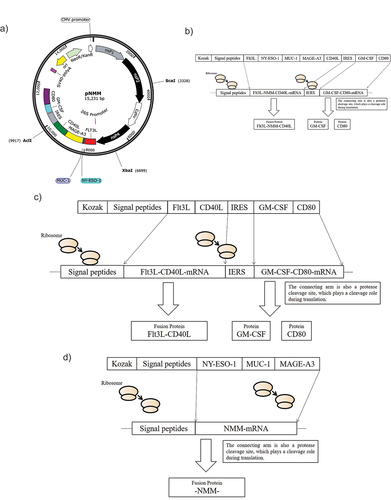
Figure 2. A schematic diagram of the experimental animal groups used in DNA vaccine immunogenicity experiments.
Figure 3. Expression of the pNMM vaccine in 293T cells.
(a) Immunoblot analysis of 293T cells transfected with blank and pNMM plasmids. 293T cells grown in six-well plates were transfected with plasmid pNMM using jetOPTIMUS transfection reagent. Vaccine proteins were probed with mouse anti- human MAGE-A3 antibodies followed by horseradish peroxidase-conjugated secondary anti-mouse antibodies. (b) Meso-scale electrochemiluminescence (MSD) analysis of supernatants from 293T cells transfected with blank and pNMM plasmids. GM-CSF signal were detected using an MSD device. (c) Flow cytometry analysis of 293T cells transfected with blank and plasmid pNMM plasmids. Percentage of CD40L- and CD80-expressing cells among 293T cells transfected with the pNMM plasmid.
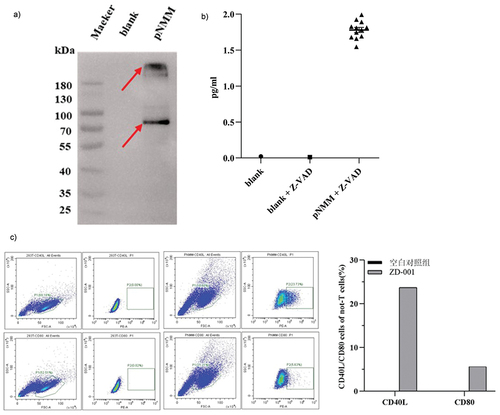
Figure 4. Evaluation of non-T cell response and specific IFN-γ-producing T cells.
C57BL/6 mice were immunized three times with pNMM plasmid (days 0, 7, and 14). At 7 to 14 days following the final immunization, detection of a CD11a/CD11c non-T cell population by flow cytometry, splenocytes from immunized mice were evaluated for (a) CD45+ CD3+ CD11a+ and (b) CD45+ CD3+ CD11c expression. (c) Flow cytometry analysis of specific IFN-γ-producing T cells. At 7 to 14 days following the final immunization, splenocytes from immunized mice were analyzed for IFN-γ-producing T cells. Representative photographs of the ELISPOT in each group are shown. (d) Percentage of specific IFN-γ-producing T cells from immunized mice in each group. Data are presented as the means ± S.D. *p < .05; **p < .01 vs. the negative control.
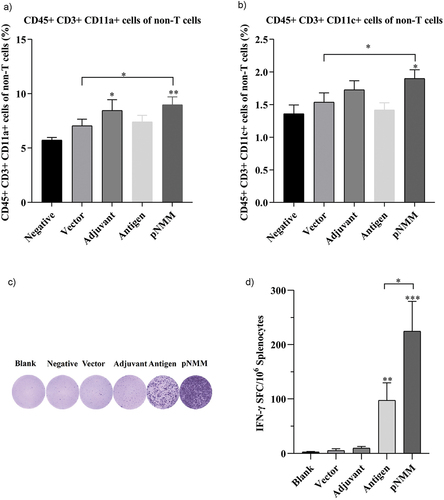
Figure 5. Protective efficacy of the DNA vaccine in a B16-NMM+-tumor model.
C57BL/6 mice were immunized three times with 1 µg of pNMM plasmid on days 0, 7, and 14. On day 7 following the final immunization, mice were subcutaneously inoculated with B16-NMM+ cells. (a) Tumor developments were measured at 2- to 3-day intervals, and the kinetics of tumor growth among immunized mice in the different groups were calculated. (b) The weight of tumors among immunized mice in the different groups was measured. (c) Rates of tumor inhibition rate among immunized mice in the different groups. (d) Survival curves of immunized mice in the different groups (different letters indicate significant differences). Data are presented as the means ± S.D.
Figure 6. Therapeutic efficacy of the DNA vaccine in a B16-NMM+-tumor model.
Three days after subcutaneously inoculating C57BL/6 mice with B16-NMM+ cells, the mice were immunized three times (days 3, 10, and 17) with 1 µg of pNMM plasmid. (a) Tumor development was measured at 2- to 3-day intervals, and the kinetics of tumor growth among immunized mice in the different groups were calculated. (b) The weight of tumor from immunized mice in each group was measured. (c) Tumor inhibition rate of immunized mice in in the different groups. (d) Survival curves of immunized mice in the different groups (different letters indicate significant differences). Data are presented as the mean ± S.D.